Coveo has experienced great growth over the last few years, by bringing in new clients, deploying in new regions, integrating new technologies, etc. But the infrastructure on which our offering sits must follow the same trend. This explosion in data and event volumes demands that companies find scalable solutions to match their ambitions. It’s a bit more complicated than simply throwing buzzwords like incantations, so I’ll help you dive a bit into this world.
Most companies working with cloud-native, distributed and scalable technologies will aim at scaling on demand, or rather scale with your wallet, so that for example, no human actions are required in preparation for Black Friday. But unfortunately, it’s not as easy as it sounds. Whether you’re moving from three to ten virtual machines, from a dozen micro-services to a hundred, or you’re preparing your ~100 nodes Kubernetes cluster to hit 300 in the next year, scaling up will inevitably lead to unforeseen problems. One of them is ensuring monitoring and alerting stays reliable for an ever-increasing number of virtual machines, micro-services and other components.
Prometheus
The time-series database Prometheus has been one of the most popular monitoring software solutions for the last decade. It’s a Cloud Native Computing Foundation project, available on Github, and its role is to gather information regularly about all the monitoring targets you configure, evaluate rules that can trigger alerts, and also expose all of its information under a query language (PromQL). The most basic use case for Prometheus could be to gather uptime information about a server, and have it post an alert in Slack when it’s down. You can also build dashboards on a visualization tool such as Grafana, which makes all sorts of queries on all your running applications.
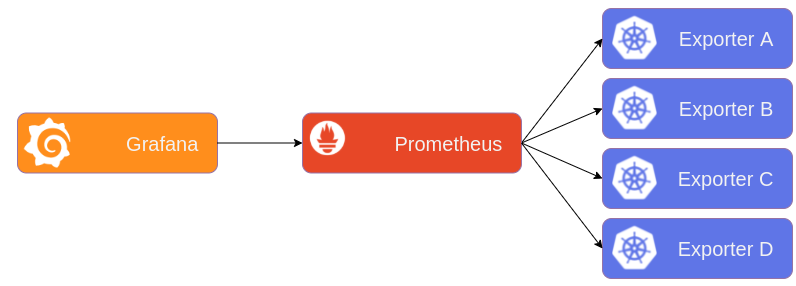
In this article I’ll refer to our multiple monitoring targets as exporters, since it’s the piece of software that knows how to present information to Prometheus. Our targets can be virtual machines, clusters, applications, cloud services, etc. Prometheus will periodically fetch information from all exporters to build its time series. And then we use our visualization platform Grafana, that asks Prometheus directly for information.
Pinch your nose as we dive deeper into the various ways in which Prometheus can be made reliable and scalable.
High availability
At first, a single Prometheus instance will be enough for millions of time series, though it can be fragile as there is no redundancy. This fragility, of course, is not acceptable. We need to be aware as soon as a client facing application is having trouble fulfilling its destiny. This means we cannot allow downtime to occur; monitoring and alerting are an essential part of our offering.
Two solutions are available to us. And we choose to have both in place.
The first and obvious one is to have an external component that will alert us if Prometheus is down. This will drastically reduce the risk of blackouts as both systems would have to be down at the same time. So the more different this component is, the safer we are from simultaneous outages.
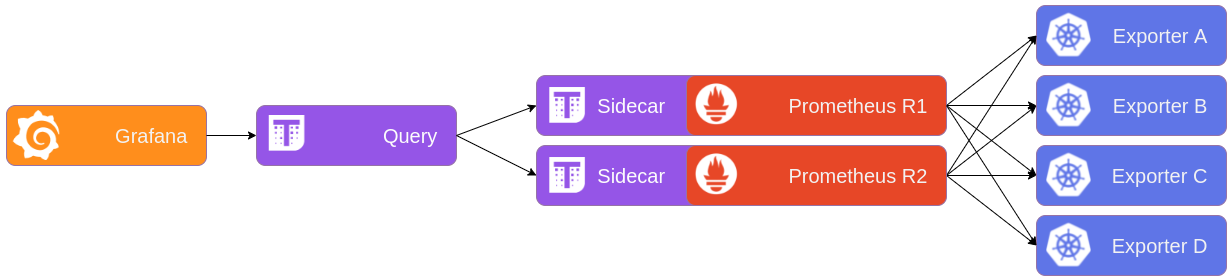
The second solution is to have multiple Prometheus instances with the same configuration (we’ll call them replicas), and later filter out duplicate metrics. Since Prometheus is essentially a database, we can’t easily host more identical instances like any stateless container. There are a few solutions that enable Prometheus to be highly available: Prometheus federation, Promxy, Thanos, Cortex, etc. We chose to work with Thanos for various reasons, such as centralized querying, longer retention period, and of course, high availability. Also, we currently have two replicas, and you could have more, but that is a balance of cost/reliability that you have to find for your specific use-case.
> kubectl get pods -n monitoring
NAME               READY   STATUS
prometheus-0       3/3     Running
prometheus-1       3/3     Running
In Kubernetes, we can greatly reduce the chances that the two instances are down at the same time using these features:
anti-affinityandpod-topology-constraints, so that our Prometheus replicas are not hosted on the same physical machine, or even in the same data center.pod-disruption-budgetto tell Kubernetes to never intentionally shutdown both replicas at the same time.
Furthermore, we now need an intermediary for Grafana to get its information. The Thanos Querier component takes care of serving both Prometheus instances under a single endpoint, and also deduplicates the data both Prometheus would have in common. The Querier also implements the PromQL language to mimic Prometheus behavior.
The alerts can still be evaluated by both Prometheus at the same time, as they will be deduplicated by Alertmanager down the line.
Vertical Scaling
As our clusters continue growing in size, there are more and more data being gathered by Prometheus, and more unique ways to categorize it. We are wondering how to manage the ever-increasing memory consumption of Prometheus. As of now, we have implemented dedicated nodes with high memory, but it will only get us so far. Our biggest prom instance uses ~70gb (and can peek at ~100gb on boot) on a cluster of ~100 nodes. Another issue, is that it can take a while for Prometheus to start.
The single most important factor in memory consumption is the cardinality of time series. This represents the sum of unique characteristics a metric can have. To keep track of the high cardinality metrics and labels, go to the Prometheus interface, under /status. There is a handy overview of the highest cardinality metrics, and a bit more…
Name                                        Count
apiserver_request_duration_seconds_bucket   38836
container_tasks_state                       16790
container_memory_failures_total             13432
You can read more on how we optimize our memory consumption in this blog post.
Sadly, vertical scaling is not good enough, because it requires manual interventions, dedicated virtual machines, and the boot time is just going to get worse. We must find another way to scale.
Horizontal Scaling
If we can’t have bigger instances, let’s have more of them!
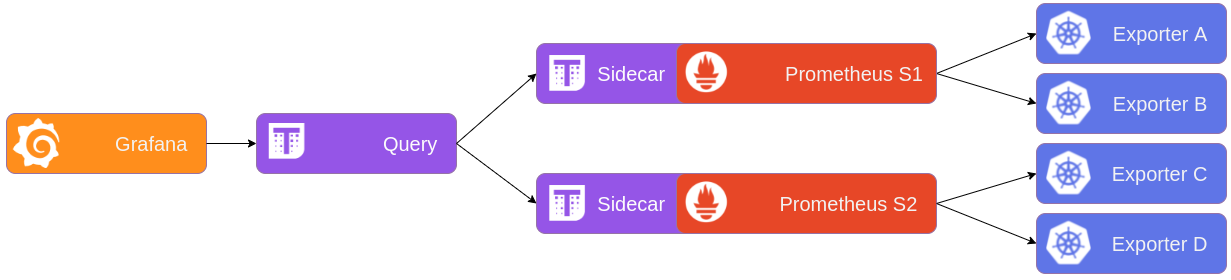
To scale horizontally, we must split the scrape targets in groups. It’s called sharding the scrape metrics. This will split Prometheus into multiple smaller instances, which we can host on different nodes, thus easily scaling by increasing the number of nodes in the cluster when required.
We can do that logically, by dividing the targets by services, such as RabbitMQ, Elasticsearch, Kubernetes, etc. Or we could have one Prometheus shard per Kubernetes namespace. But I think the best approach is to use a pseudo-random division of all our scrape targets, so that we can manage our multiple shards as one big Prometheus stack and, more importantly, scale on demand without human interactions.
To accomplish that, an entity controlling all Prometheus shards will be in charge of splitting the configuration, using a modulo of the desired number of shards on a hash of our scrape targets. This entity can be the Prometheus operator, living alongside our Prometheus and Alertmanager pods.
> kubectl get pods -n monitoring
NAME                  READY   STATUS
prometheus-shard-0    3/3     Running
prometheus-shard-1    3/3     Running
As with our highly available replicas, we need to have a centralized query endpoint. In our case, using Thanos Querier, we can ask questions on all Prometheus instances at once.
With sharding in place, Prometheus rules won’t work anymore, because half the metrics will be on shard A, and the other half over shard B. So you have to evaluate all the rules and alerts on a component that will have all of your metrics combined. In our case this is the Thanos Ruler, which feeds off the Thanos Querier.
And there we have a solid solution for scaling on demand. We can further divide the pool of monitoring targets into more Prometheus shards, splitting the resource demand on multiple instances.
Putting it all together
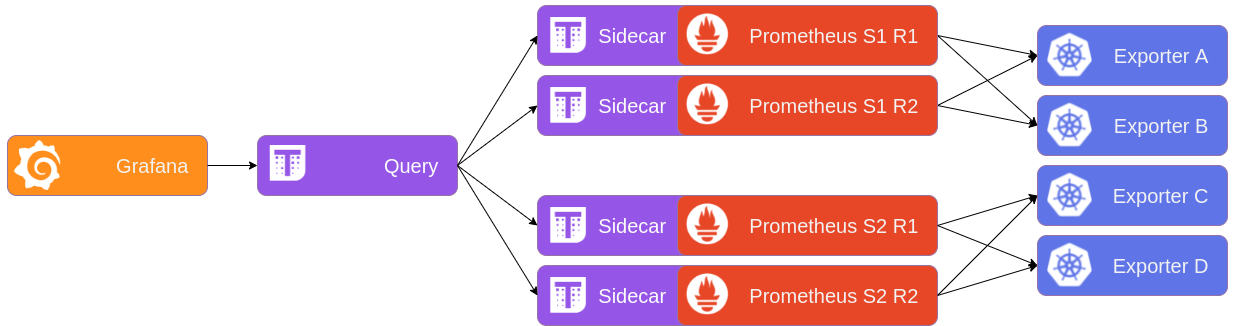
In order to have both high availability and scaling potential, the setup must look like the following schema. Both shards now have each their own replica pairs, and the Thanos Querier makes sense of all that using a bit of configuration.
> kubectl get pods -n monitoring
NAME                    READY   STATUS
prometheus-0-shard-0    3/3     Running
prometheus-0-shard-1    3/3     Running
prometheus-1-shard-0    3/3     Running
prometheus-1-shard-1    3/3     Running
With that tested and deployed, we can now scale horizontally at will, adding more shards as we go.
Querying multiple clusters
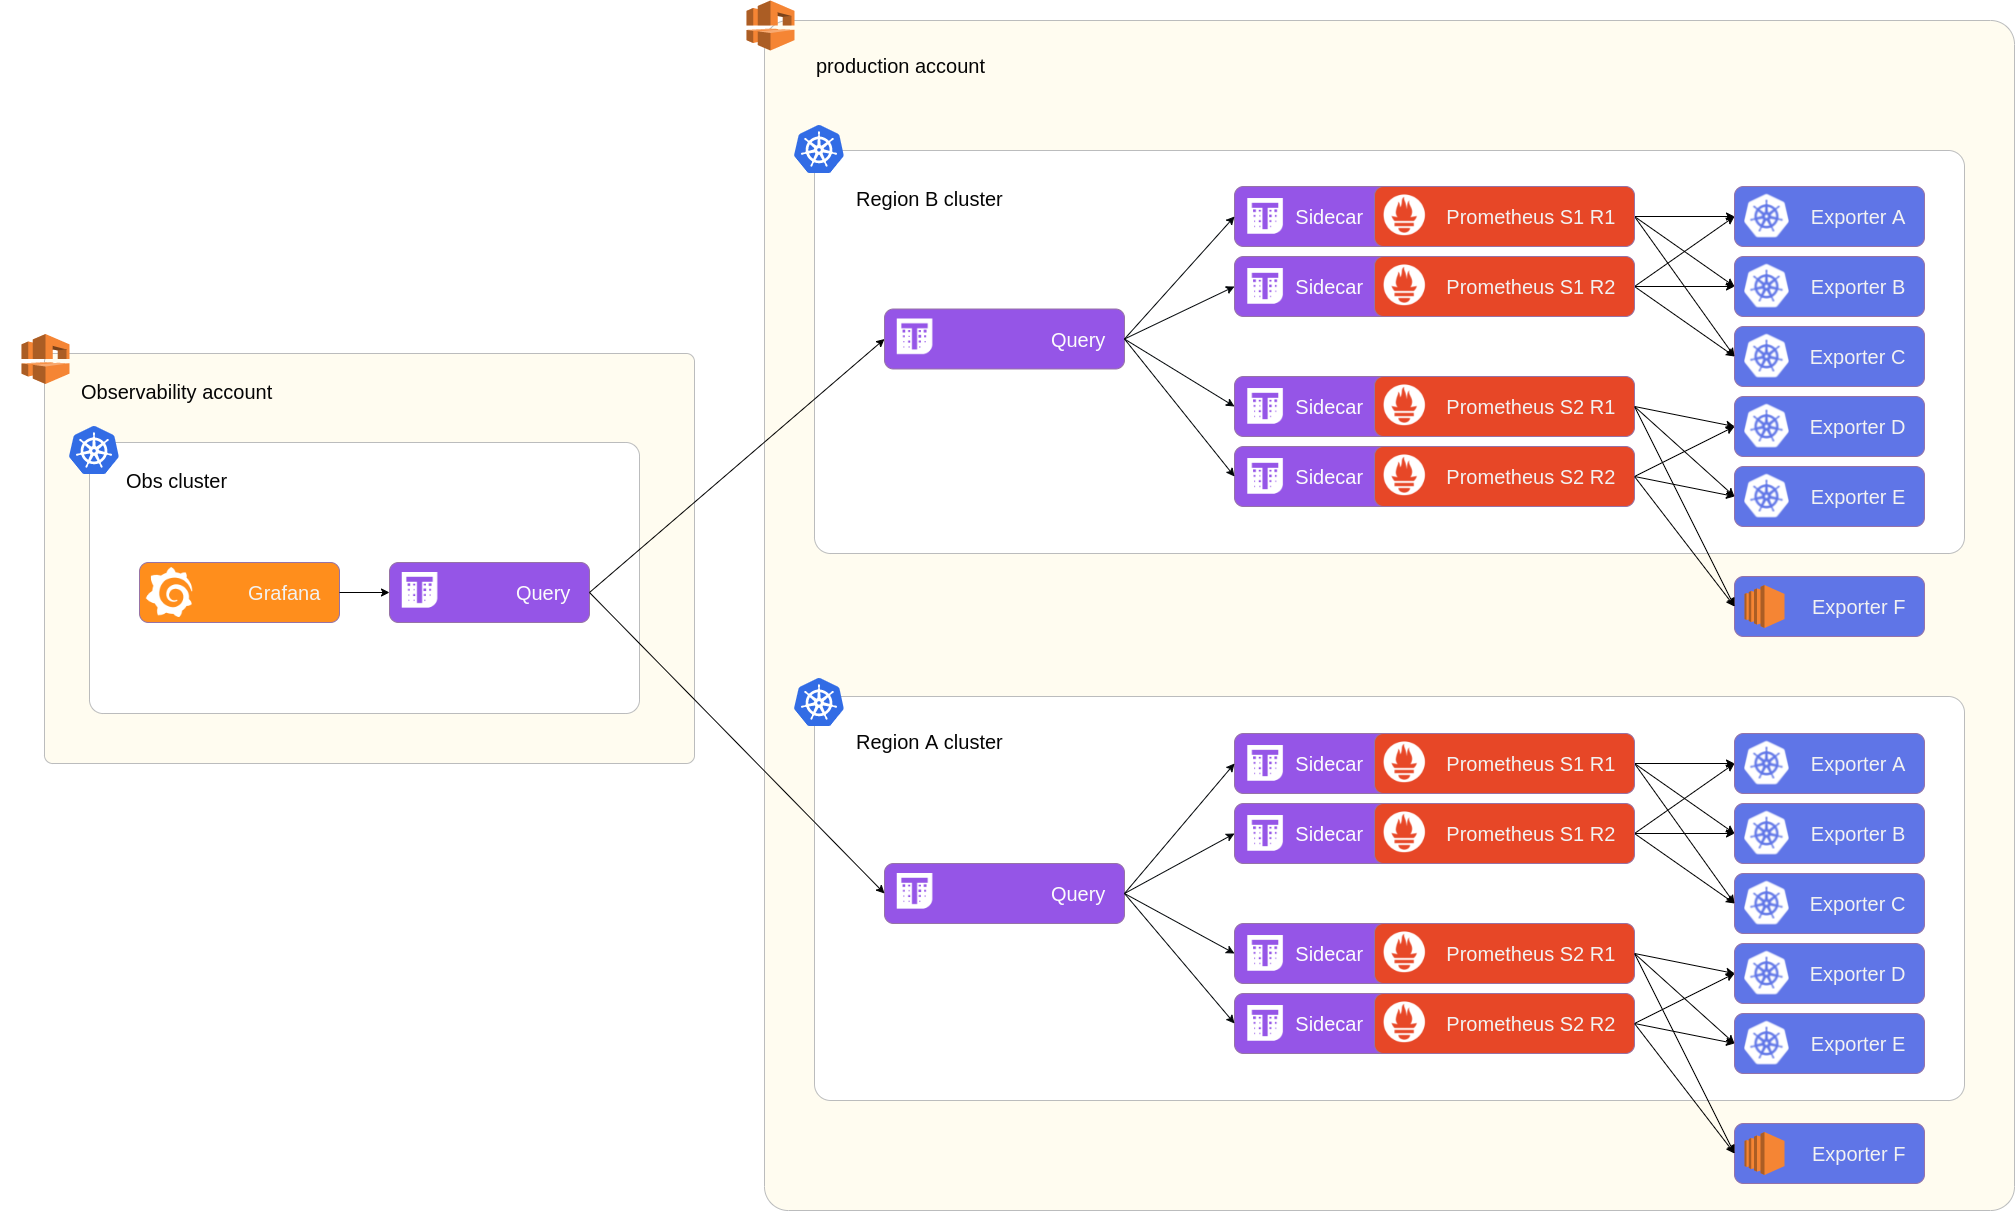
In our setup, this monitoring software stack is in place in each Kubernetes cluster, which we have a dozen of. This results in a lot of places to look at when you want to visualize the same metric over multiple clusters.
Now I hear you ask, but is there a place I can see all of that at the same time?
Well yes! To do that, we have a special cluster in a dedicated environment (let’s call it observability) which will be able to talk to all other clusters. Since the Thanos Query component can also use other Queriers as data sources, we can use them to bridge our different clusters in order for Grafana to have a unified view of everything!
Whats next?
We could include the Prometheus adapter in our architecture to help distribute the discovery and scraping load on dedicated components, but it’s still a work in progress on Prometheus’s side. We will follow the development of this feature.
But as far as we go, using the architecture described in this post, Prometheus will now scale with our ambition and our wallet!
Onto the next component!
Do you like working on this type of challenge? Check out our careers page.