At Coveo, we use Prometheus 2 for collecting all of our monitoring metrics. Prometheus is known for being able to handle millions of time series with only a few resources. So when our pod was hitting its 30Gi memory limit, we decided to dive into it to understand how memory is allocated, and get to the root of the issue.
Recently, we ran into an issue where our Prometheus pod was killed by Kubenertes because it was reaching its 30Gi memory limit. This surprised us, considering the amount of metrics we were collecting. For comparison, benchmarks for a typical Prometheus installation usually looks something like this:
- 800 microservice + k8s
- 120,000 sample/second
- 300,000 active time series
- 3Go of ram
On our end, we had the following:
- 640 target
- 20,000 sample/second
- 1 M active time series ( sum(scrape_samples_scraped) )
- 5.5 M total time series
- 40Go of ram
Before diving into our issue, let’s first have a quick overview of Prometheus 2 and its storage (tsdb v3).
Vocabulary
Datapoint: Tuple composed of a timestamp and a value.
Metric: Specifies the general feature of a system that is measured (e.g., http_requests_total is the total number of HTTP requests received).
Time series: Set of datapoint in a unique combinaison of a metric name and labels set. For instance, here are 3 different time series from the up metric:
up{endpoint="9106",instance="100.99.226.5:9106",job="cw-exp-efs-pp",namespace="infrastructure",pod="cw-exp-efs-pp-74f9898c48-4r9p5",service="cw-exp-efs-pp"}
up{endpoint="9115",instance="100.100.99.15:9115",job="blackbox-exporter",namespace="monitoring",pod="blackbox-exporter-7848648fd5-ndrtk",service="blackbox-exporter"}
up{endpoint="9115",instance="100.106.50.198:9115",job="blackbox-exporter",namespace="monitoring",pod="blackbox-exporter-7848648fd5-mqjjf",service="blackbox-exporter"}
Target: Monitoring endpoint that exposes metrics in the Prometheus format.
Chunk: Batch of scraped time series.
Series Churn: Describes when a set of time series becomes inactive (i.e., receives no more data points) and a new set of active series is created instead. Rolling updates can create this kind of situation.
Blocks: A fully independent database containing all time series data for its time window. It has its own index and set of chunk files.
Head Block: The currently open block where all incoming chunks are written.
Sample: A collection of all datapoint grabbed on a target in one scrape.
Prometheus Storage (tsdb)
Storage
When Prometheus scrapes a target, it retrieves thousands of metrics, which are compacted into chunks and stored in blocks before being written on disk. Only the head block is writable; all other blocks are immutable. By default, a block contain 2 hours of data.
To prevent data loss, all incoming data is also written to a temporary write ahead log, which is a set of files in the wal directory, from which we can re-populate the in-memory database on restart.
While the head block is kept in memory, blocks containing older blocks are accessed through mmap(). This system call acts like the swap; it will link a memory region to a file. This means we can treat all the content of the database as if they were in memory without occupying any physical RAM, but also means you need to allocate plenty of memory for OS Cache if you want to query data older than fits in the head block.
Compactions
The head block is flushed to disk periodically, while at the same time, compactions to merge a few blocks together are performed to avoid needing to scan too many blocks for queries.
The wal files are only deleted once the head chunk has been flushed to disk.
Investigation
Usage evaluation
Disk usage
needed_disk_space = retention_time_seconds * ingested_samples_per_second * bytes_per_sample (~2B)
360 * 3600 * 20000 * 2 = 51 Go
Maximum Ram usage
Needed_ram = number_of_serie_in_head * 8Kb (approximate size of a time series. number of value store in it are not so important because it’s only delta from previous value)
5 500 000 * 8 = 44 Go
Analyze memory usage
Prometheus exposes Go profiling tools, so let’s see what we have.
$ go tool pprof -symbolize=remote -inuse_space https://monitoring.prod.cloud.coveo.com/debug/pprof/heap
File: prometheus
Type: inuse_space
Time: Apr 24, 2019 at 4:20pm (CEST)
Entering interactive mode (type "help" for commands, "o" for options)
(pprof) top
Showing nodes accounting for 8839.83MB, 84.87% of 10415.77MB total
Dropped 398 nodes (cum <= 52.08MB)
Showing top 10 nodes out of 64
      flat  flat%   sum%        cum   cum%
 1628.82MB 15.64% 15.64%  1628.82MB 15.64%  github.com/prometheus/tsdb/index.(*decbuf).uvarintStr /app/vendor/github.com/prometheus/tsdb/index/encoding_helpers.go
 1233.86MB 11.85% 27.48%  1234.86MB 11.86%  github.com/prometheus/prometheus/pkg/textparse.(*PromParser).Metric /app/pkg/textparse/promparse.go
 1199.99MB 11.52% 39.00%  1199.99MB 11.52%  github.com/prometheus/tsdb.seriesHashmap.set /app/vendor/github.com/prometheus/tsdb/head.go
 1186.88MB 11.40% 50.40%  1186.88MB 11.40%  github.com/prometheus/prometheus/pkg/labels.(*Builder).Labels /app/pkg/labels/labels.go
  987.60MB  9.48% 59.88%   987.60MB  9.48%  github.com/prometheus/tsdb/chunkenc.NewXORChunk /app/vendor/github.com/prometheus/tsdb/chunkenc/xor.go
  836.65MB  8.03% 67.91%   836.65MB  8.03%  github.com/prometheus/tsdb.newMemSeries /app/vendor/github.com/prometheus/tsdb/head.go
  650.21MB  6.24% 74.16%  1850.20MB 17.76%  github.com/prometheus/tsdb.(*stripeSeries).getOrSet /app/vendor/github.com/prometheus/tsdb/head.go
  450.52MB  4.33% 78.48%   450.52MB  4.33%  github.com/prometheus/tsdb/index.newReader.func2 /app/vendor/github.com/prometheus/tsdb/index/index.go
  360.78MB  3.46% 81.95%   360.78MB  3.46%  github.com/prometheus/tsdb/index.(*MemPostings).Delete /app/vendor/github.com/prometheus/tsdb/index/postings.go
  304.51MB  2.92% 84.87%   304.51MB  2.92%  github.com/prometheus/tsdb.(*decbuf).uvarintStr /app/vendor/github.com/prometheus/tsdb/encoding_helpers.go
First, we see that the memory usage is only 10Gb, which means the remaining 30Gb used are, in fact, the cached memory allocated by mmap.
Second, we see that we have a huge amount of memory used by labels, which likely indicates a high cardinality issue. High cardinality means a metric is using a label which has plenty of different values.
Analyze label usage
The tsdb binary has an analyze option which can retrieve many useful statistics on the tsdb database.
So we decided to copy the disk storing our data from prometheus and mount it on a dedicated instance to run the analysis.
Block path: /prometheus/prometheus-db/01D9CMTKZAB0R8T4EM95PKXKQ6
Duration: 2h0m0s
Series: 5547383
Label names: 248
Postings (unique label pairs): 159621
Postings entries (total label pairs): 44259261

Label pairs most involved in churning:
4424281 job=kubelet
4424281 service=monitoring-prometheus-oper-kubelet
4417556 endpoint=cadvisor
1154707 __name__=container_network_tcp_usage_total
524866 __name__=container_tasks_state
419893 __name__=container_memory_failures_total
419893 __name__=container_network_udp_usage_total
209946 scope=hierarchy
209946 type=pgfault
209946 scope=container
209946 type=pgmajfault
124554 node=ip-10-1-28-104.ec2.internal
124547 instance=10.1.28.104:4194
123625 node=ip-10-1-31-50.ec2.internal
123619 instance=10.1.31.50:4194
123535 node=ip-10-1-24-105.ec2.internal
123528 instance=10.1.24.105:4194
123455 node=ip-10-1-26-91.ec2.internal
123449 instance=10.1.26.91:4194
122999 node=ip-10-1-30-66.ec2.internal
122992 instance=10.1.30.66:4194

Label names most involved in churning:
4448288 __name__
4448286 service
4448286 job
4448280 instance
4448280 endpoint
4425365 node
4417169 id
1154707 tcp_state
524867 state
420440 type
419951 scope
419893 udp_state
61127 namespace
54746 device
53712 cpu
30180 image
30111 name
29976 pod_name
29976 container_name
23829 pod
11653 interface

Most common label pairs:
5230403 job=kubelet
5230403 service=monitoring-prometheus-oper-kubelet
5181993 endpoint=cadvisor
1332991 __name__=container_network_tcp_usage_total
605905 __name__=container_tasks_state
484724 __name__=container_network_udp_usage_total
484724 __name__=container_memory_failures_total
242362 type=pgfault
242362 scope=hierarchy
242362 scope=container
242362 type=pgmajfault
198766 endpoint=http
178005 namespace=infrastructure
137297 namespace=monitoring
135105 node=ip-10-1-28-104.ec2.internal
134282 instance=10.1.28.104:4194
133879 node=ip-10-1-24-105.ec2.internal
133623 node=ip-10-1-26-91.ec2.internal
133602 node=ip-10-1-31-50.ec2.internal
133540 node=ip-10-1-21-53.ec2.internal
133170 node=ip-10-1-28-252.ec2.internal

Highest cardinality labels:
116525 id
19148 type
4794 queue
3655 mountpoint
2926 __name__
2323 name
1073 container_id
956 exported_pod
949 pod_name
747 pod_ip
697 device
678 interface
657 instance
523 pod
286 replicaset
205 url
176 instance_type
173 le
146 image
133 address
90 container

Highest cardinality metric names:
1332991 container_network_tcp_usage_total
605905 container_tasks_state
484724 container_memory_failures_total
484724 container_network_udp_usage_total
121181 container_memory_swap
121181 container_start_time_seconds
121181 container_memory_rss
121181 container_memory_usage_bytes
121181 container_memory_working_set_bytes
121181 container_memory_failcnt
121181 container_memory_max_usage_bytes
121181 container_memory_cache
121181 container_last_seen
121181 container_cpu_user_seconds_total
121181 container_cpu_system_seconds_total
121181 container_cpu_load_average_10s
121173 container_spec_cpu_period
121173 container_spec_cpu_shares
120963 container_spec_memory_limit_bytes
120963 container_spec_memory_swap_limit_bytes
120963 container_spec_memory_reservation_limit_bytes
We can see that the monitoring of one of the Kubernetes service (kubelet) seems to generate a lot of churn, which is normal considering that it exposes all of the container metrics, that container rotate often, and that the id label has high cardinality.
Actions
The only action we will take here is to drop the id label, since it doesn’t bring any interesting information.
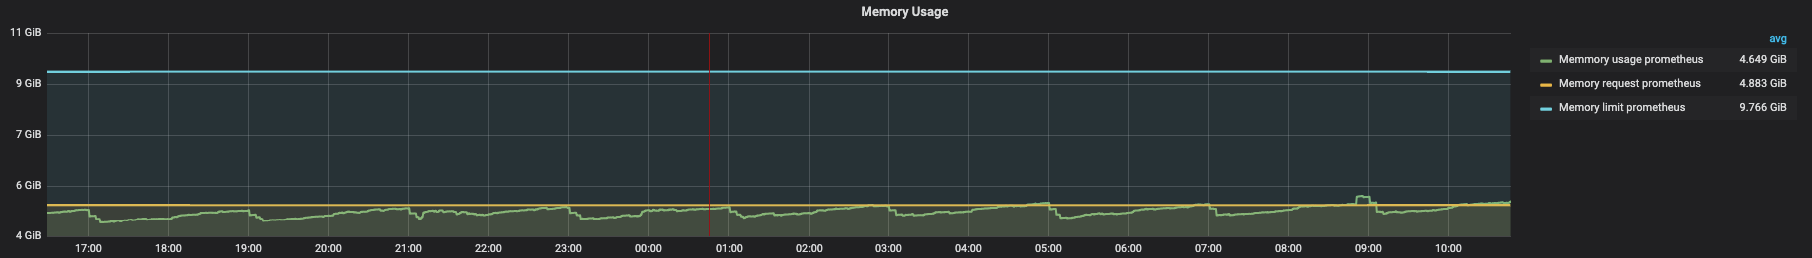
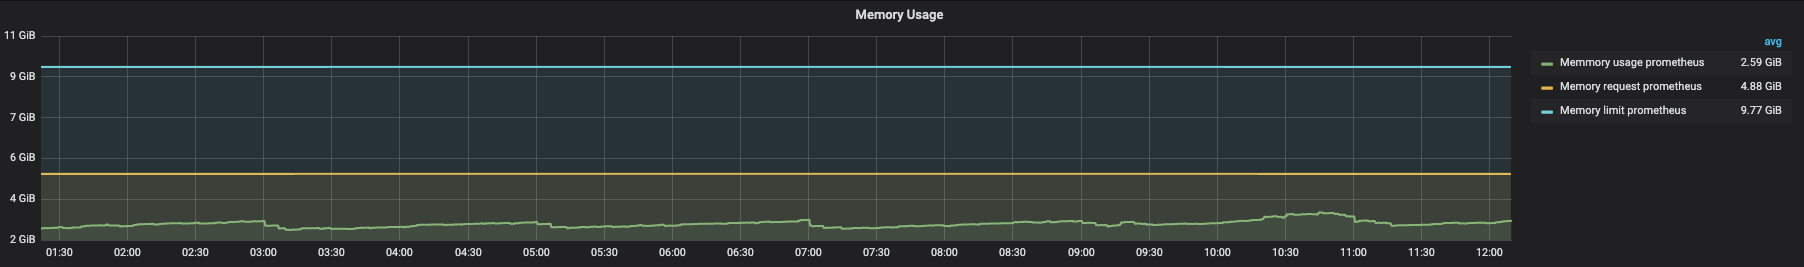
DEV
Before optimization
After
PROD
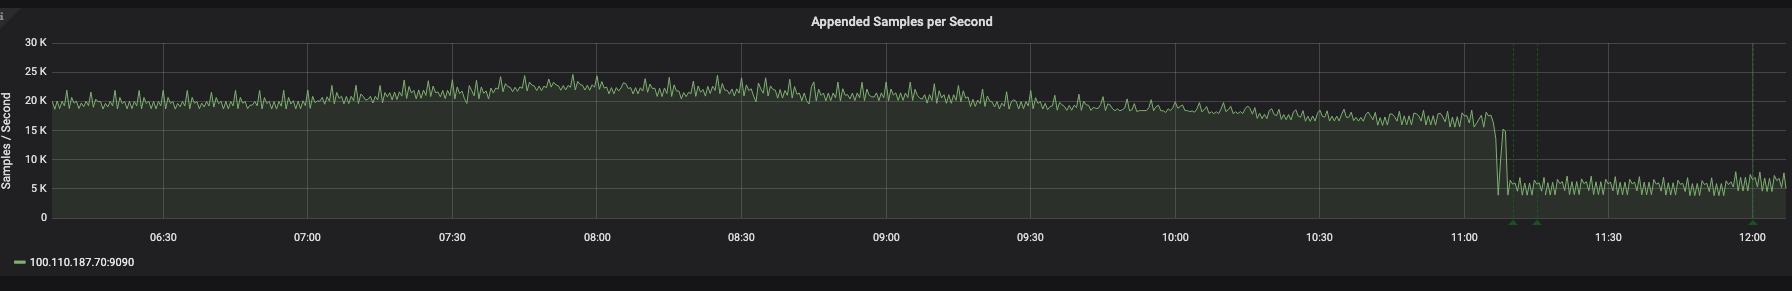
After applying optimization, the sample rate was reduced by 75%.
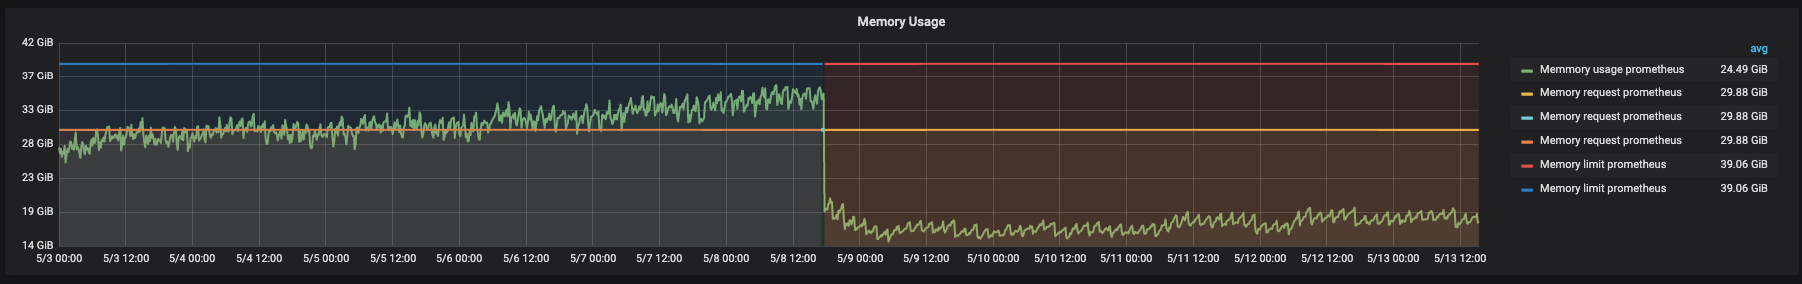
Pod memory usage was immediately halved after deploying our optimization and is now at 8Gb, which represents a 375% improvement of the memory usage.
What we learned
- Labels in metrics have more impact on the memory usage than the metrics itself.
- Memory seen by Docker is not the memory really used by Prometheus.
- The Go profiler is a nice debugging tool.
Useful urls
Are you also obsessed with optimization? Do you like this kind of challenge? Join the Coveo team to be with like minded individual who like to push the boundaries of what is possible!