The context
The site reliability engineering (SRE) team at Coveo is currently hard at work implementing tools and processes with a lofty goal in mind: moving our existing monitoring culture in R&D toward the systematic use of service-level objectives (SLO). Writing blogs about SLOs or announcing products making use of them is pretty common nowadays, and understandably so. Yet I’m finding that most of the discourse around this topic is limited to the same kind of examples and use cases. In this blog post, I will tell the convoluted story of a definitely unconventional SLO.
But first, a refresher. What is an SLO? A service-level objective is an acceptability threshold relating to the performance of a service. This concept also has an inseparable twin, the service-level indicator or SLI. The SLI is a measurement of a service’s behavior expressed as the frequency of some successful state or result, for example, the number of requests that return HTTP 200 OK responses, or the number of jobs that completed within 5 minutes. A simple guidance to ensure that your SLI is expressed in this conventional way is that your measurement is an unequivocal yes/no or true/false proposition. Did a response return a 200 OK? Did a job complete within 5 minutes? This is so that you can calculate the ratio of good versus bad events. This is your SLI measurement:

An acceptable value of this SLI, within a predetermined time window, is your SLO. The intent behind the time window is to calculate an error budget (EB) and a burn rate (EBBR). The main purpose of the EB is to represent the margin of error within which you are allowing your service to operate. An empty budget should always represent the moment when your customers begin to feel unhappy; a non-empty budget means you can allow yourself to deploy, or even experiment with, application changes. The related EBBR will then be used for alerting when the budget is ailing because your service is going south (or you are messing dangerously with it!). In short:

In concrete terms, you could declare that 99.9% of your requests in the last 24h should return 200 OK, or that 95% of the jobs within the last 28 days should complete within 5 minutes. SLOs such as these are much more than mere monitoring redlines on a dashboard. They are, in essence, quality pledges to your customers.
Up until now at Coveo our implementation of SLOs has leveraged Honeycomb, which uses distributed tracing to propel request observability to impressive heights. Using this data, setting up availability and latency SLOs is not only easy, but also quite appropriate. Thanks to its almost limitless cardinality, drilling down into traces and cross-associating multiple properties allow for very deep investigations.
It turns out however that the SRE team has a very different kind of SLO on its hands, the implementation of which has been the opposite of straightforward. Here is why.
The problem
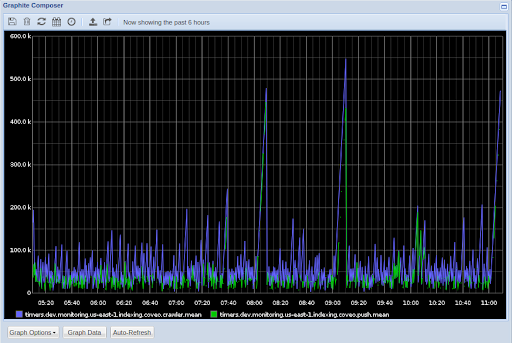
Since around the year 2 BC (Before Covid), I have been maintaining a metric that tracks how long it takes for a simple document to go through our indexing pipeline after being either pushed by API or pulled by what we call a crawler. The idea behind this is to observe the health of the pipeline at a higher level. When this simple document takes too long to index and become available for querying, chances are that this is indicative of a problem for everyone else too. In theory, this metric is nothing less than perfect for a SLO. In practice, however, reality begged to differ.
This metric is the result of an automated operation (using an AWS lambda function) that evaluates given states, computes a result, and sends it to an external metric backend, HostedGraphite. This service does its job very well, but only that – hosting the data. There are no SLO features on top of it that we can take advantage of.
Since our metric is generated by an automated job that performs an end-to-end test, this means that Honeycomb is not particularly relevant to our problem. The value we are tracking (a delay) does not stand for a request and there is no tracing involved. There are versions of our universe in which we can indeed push custom metrics into Honeycomb, but our current implementation of this service is not meant for that and it would amount to the usual square peg in a round hole problem.
We thought briefly about the Grafana Cloud observability platform, as it does support both SLOs and Graphite data, but this application is such a hugely complex offering that we cannot just cherry pick a single functionality for one use case, however important it may be. We’re not going to buy a 73-function swiss-army knife just because we need a can opener. Well, I would, but the point still stands that this is the wrong way to go about it.
In short, we need to find the proper backend for our data, one that properly supports SLOs. But this requirement is only half the problem.
In Google’s Site Relability Workbook, there is a table listing seven different types of SLIs depending on the types of components in play. The one that applies to our use case here is the freshness SLI for a pipeline-type component. While this sounds straightforward enough, when looking for a proper backend to support this particular type of SLI/SLO, it turns out that nobody is ever talking about it.
The vast majority of platforms range between exclusively documenting request-driven availability and latency SLOs and exclusively supporting them. Sloth’s documentation examples, for instance, only mention these common SLIs. Its list of plugins is even more telling. It is no surprise then that Pyrra, another tool built on top of Prometheus, only supports availability and latency. I will come back to Prometheus later in this blog post, but in the meantime let’s appreciate how even Google Cloud’s documentation only mentions the same two SLIs/SLOs. Which kind of SLOs does AWS Cloudwatch’s new Application Signals support out-of-the-box? You may take a wild guess, and then see the answer down at point 5d in the relevant documentation.
While I do understand the gravitational pull that application availability and latency SLOs may have, a cynical side of me fears that we are witnessing a bit of a bandwagon effect going on here. Fair enough. Our requirement for a freshness SLO is clear and if we need to cook up our own recipe for it, then we shall do so.
The solution
The first part of the solution was to move the raw data closer to our infrastructure – to AWS Cloudwatch. The automated job, as well as many other related ones, already run on AWS lambda functions. It made sense to start from there.
 |
|---|
| Original data in HostedGraphite |
 |
|---|
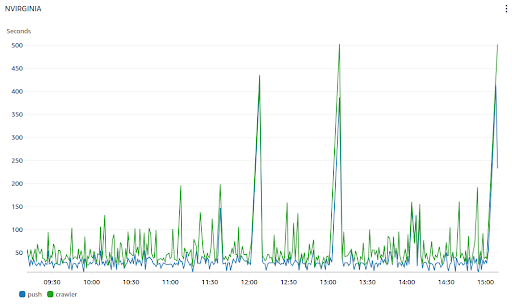
| Same data but in AWS Cloudwatch |
I mentioned above that Cloudwatch recently added a new SLO feature, through Application Signals. This new service automatically collects your application metrics and allows you to define SLIs and SLOs on top of that. This is not our use case but, thankfully, it also supports SLOs based on any custom metric! The move to Cloudwatch thus felt quite timely. However, this feature is so fresh from the oven that it is not particularly versatile. For example, it does not track burn rate (which is a very valuable target for alerting, a strategy that Google is quite keen on), nor can we easily set multiple alerting thresholds or windows. To achieve the latter, we would have to create multiple SLOs on top of the same metric (our SLI), each with its own single window and alert. This is impractical, without even going into the kind of virtuoso implementations involving proper multi-window, multi-burn-rate alerting.
A reasonable requirement is that we can enjoy alerting features on par with our SLOs in Honeycomb: at least one burn rate alert (i.e. when the error budget is being drained too fast) and at least one budget exhaustion alert (i.e. the remaining error budget is too low). What can we do then, short of calculating the SLOs ourselves?
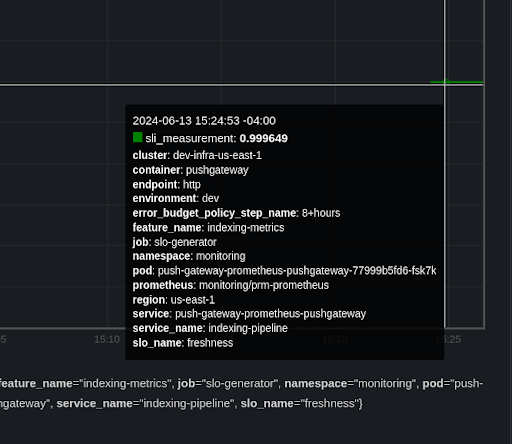
We turn to implementing Google’s very own slo-generator. This Python tool does exactly what we need: measuring SLI compliance and computing error budget and burn rate. I bundled this tool in a new AWS Lambda function, alongside a custom backend class for pulling our data from Cloudwatch. It then did its magic by pushing its results to our Prometheus stack, as it is one of slo-generator’s default exporters. Witnessing our first SLI measurement live was quite satisfying:
 |
|---|
| An SLI calculation sent to Prometheus. 99.96% is not bad at all! |
As a famished philosopher once said, however, there’s no such thing as a free lunch. This solution requires us to use Prometheus Pushgateway, which was kindly installed by our infrastructure team for the sake of this proof of concept. The one important thing to know about Pushgateway is that its documentation begins by telling us when not to use it (see also here). This literal warning sign is not trivial. Prometheus works best by pulling (or scraping) data. This should not be surprising when the application metrics it collects are in effect bound to the instances that run that application. Our indexing metric here is independent of that, though, and in fact this is precisely the only acceptable use case for Pushgateway. Yet the fact remains that Pushgateway is not a metrics backend – it is merely a metrics cache. This comes with its own sets of caveats and challenges. Did we really need to burden ourselves with them?
We did not! As I could add a custom backend to slo-generator, so could I add a custom exporter redirecting all its calculation results to Cloudwatch itself instead. Thus the same AWS lambda function I created simply pushed back its results to the same backend as its source data.
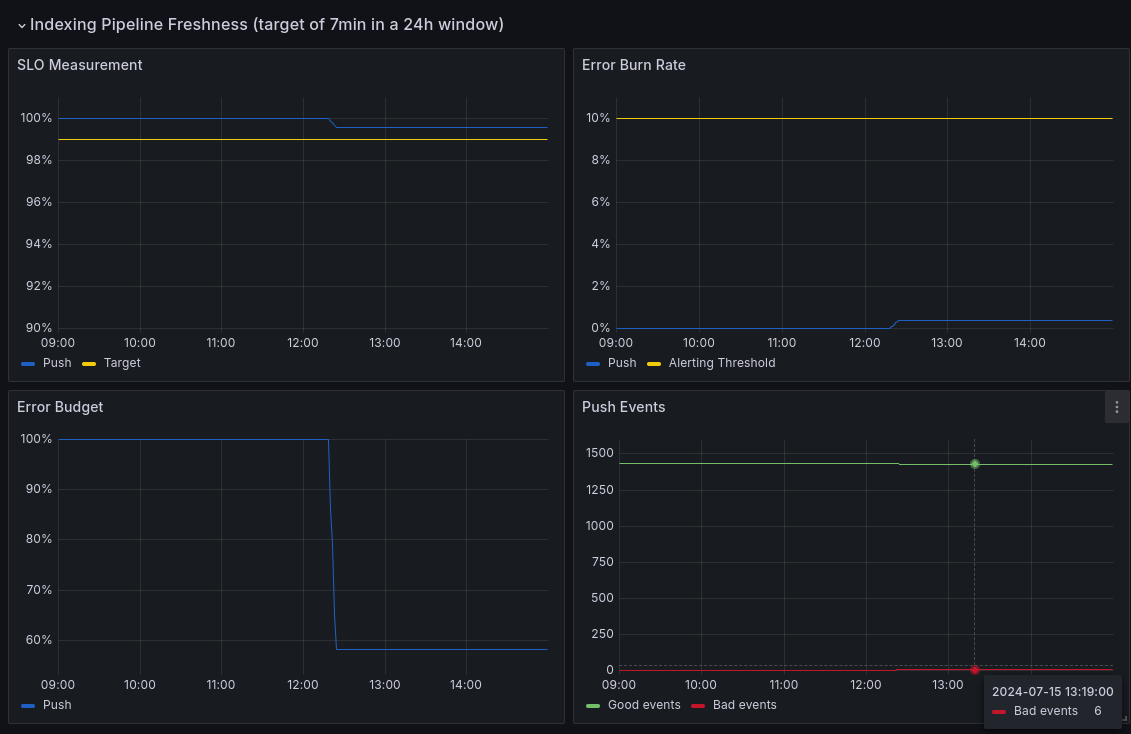
 |
|---|
| Indexing a Push document should take less than 7 minutes, 99% of the time within 24 hours. 6 bad events affected our error budget somewhat, but thankfully our compliance is still above 99%! (This data is from our development environment only) |
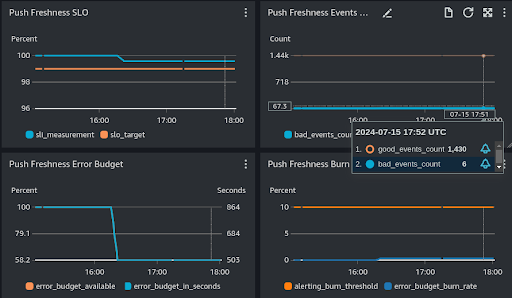
The benefit of using Cloudwatch as a backend for our custom SLO – let’s not be shy about it – is that we can potentially re-use this data in many other ways, not just within AWS Cloudwatch. This is why I was able to add one last column to the edifice: a custom Prometheus collector/exporter that can pull our SLO data (as it should be) so that in the end, we get the same result as if we were using Pushgateway, without the hassle of maintaining it. This way, we can enjoy Grafana’s powerful visualization tools, though of course the actual graphs shown below remain quite simple for the time being:
 |
|---|
| Our now familiar Push freshness SLO, here shown in Grafana, collected through Prometheus (again, all data is from our development environment only) |
And so here we are! A fully functional freshness SLO, built up from several individual smaller pieces.
The upshot
For sure, our end game is going through a lot of hoops, but let’s revisit our requirements:
- Ability to push custom metrics to a backend
- Ability to compute SLI compliance, error budget, and burn rate on which we can alert
- Ability to represent SLOs that are not of availability or latency types
- Ability to store this SLO data in a reliable backend
Using an efficient but generic tool, Google’s slo-generator, alongside AWS Cloudwatch and Lambda functions is all that it took in the end. The road to get there was certainly not a straightforward one – this post only describes the result, sparing you from the many different iterations of this proof of concept. But I do hope the retained solution offers a proper way forward for all kinds of unconventional (but legitimate) SLOs we can come up with here at Coveo.
One of my favorite benefits of using Google’s slo-generator is how SLOs are defined through a YAML spec. I did not have the space to dwell on that here, but this is one of the areas I really want to exploit further down the line. As we already support Honeycomb SLOs as code (in this case, Terraform), I am hoping that eventually we can make all our SLOs uniform through a shared specification language, such as OpenSLO. I firmly believe this will be of great help not only to drive, but also to scale up our adoption of SLOs. So until then, may your queries flow and the pagers stay silent!
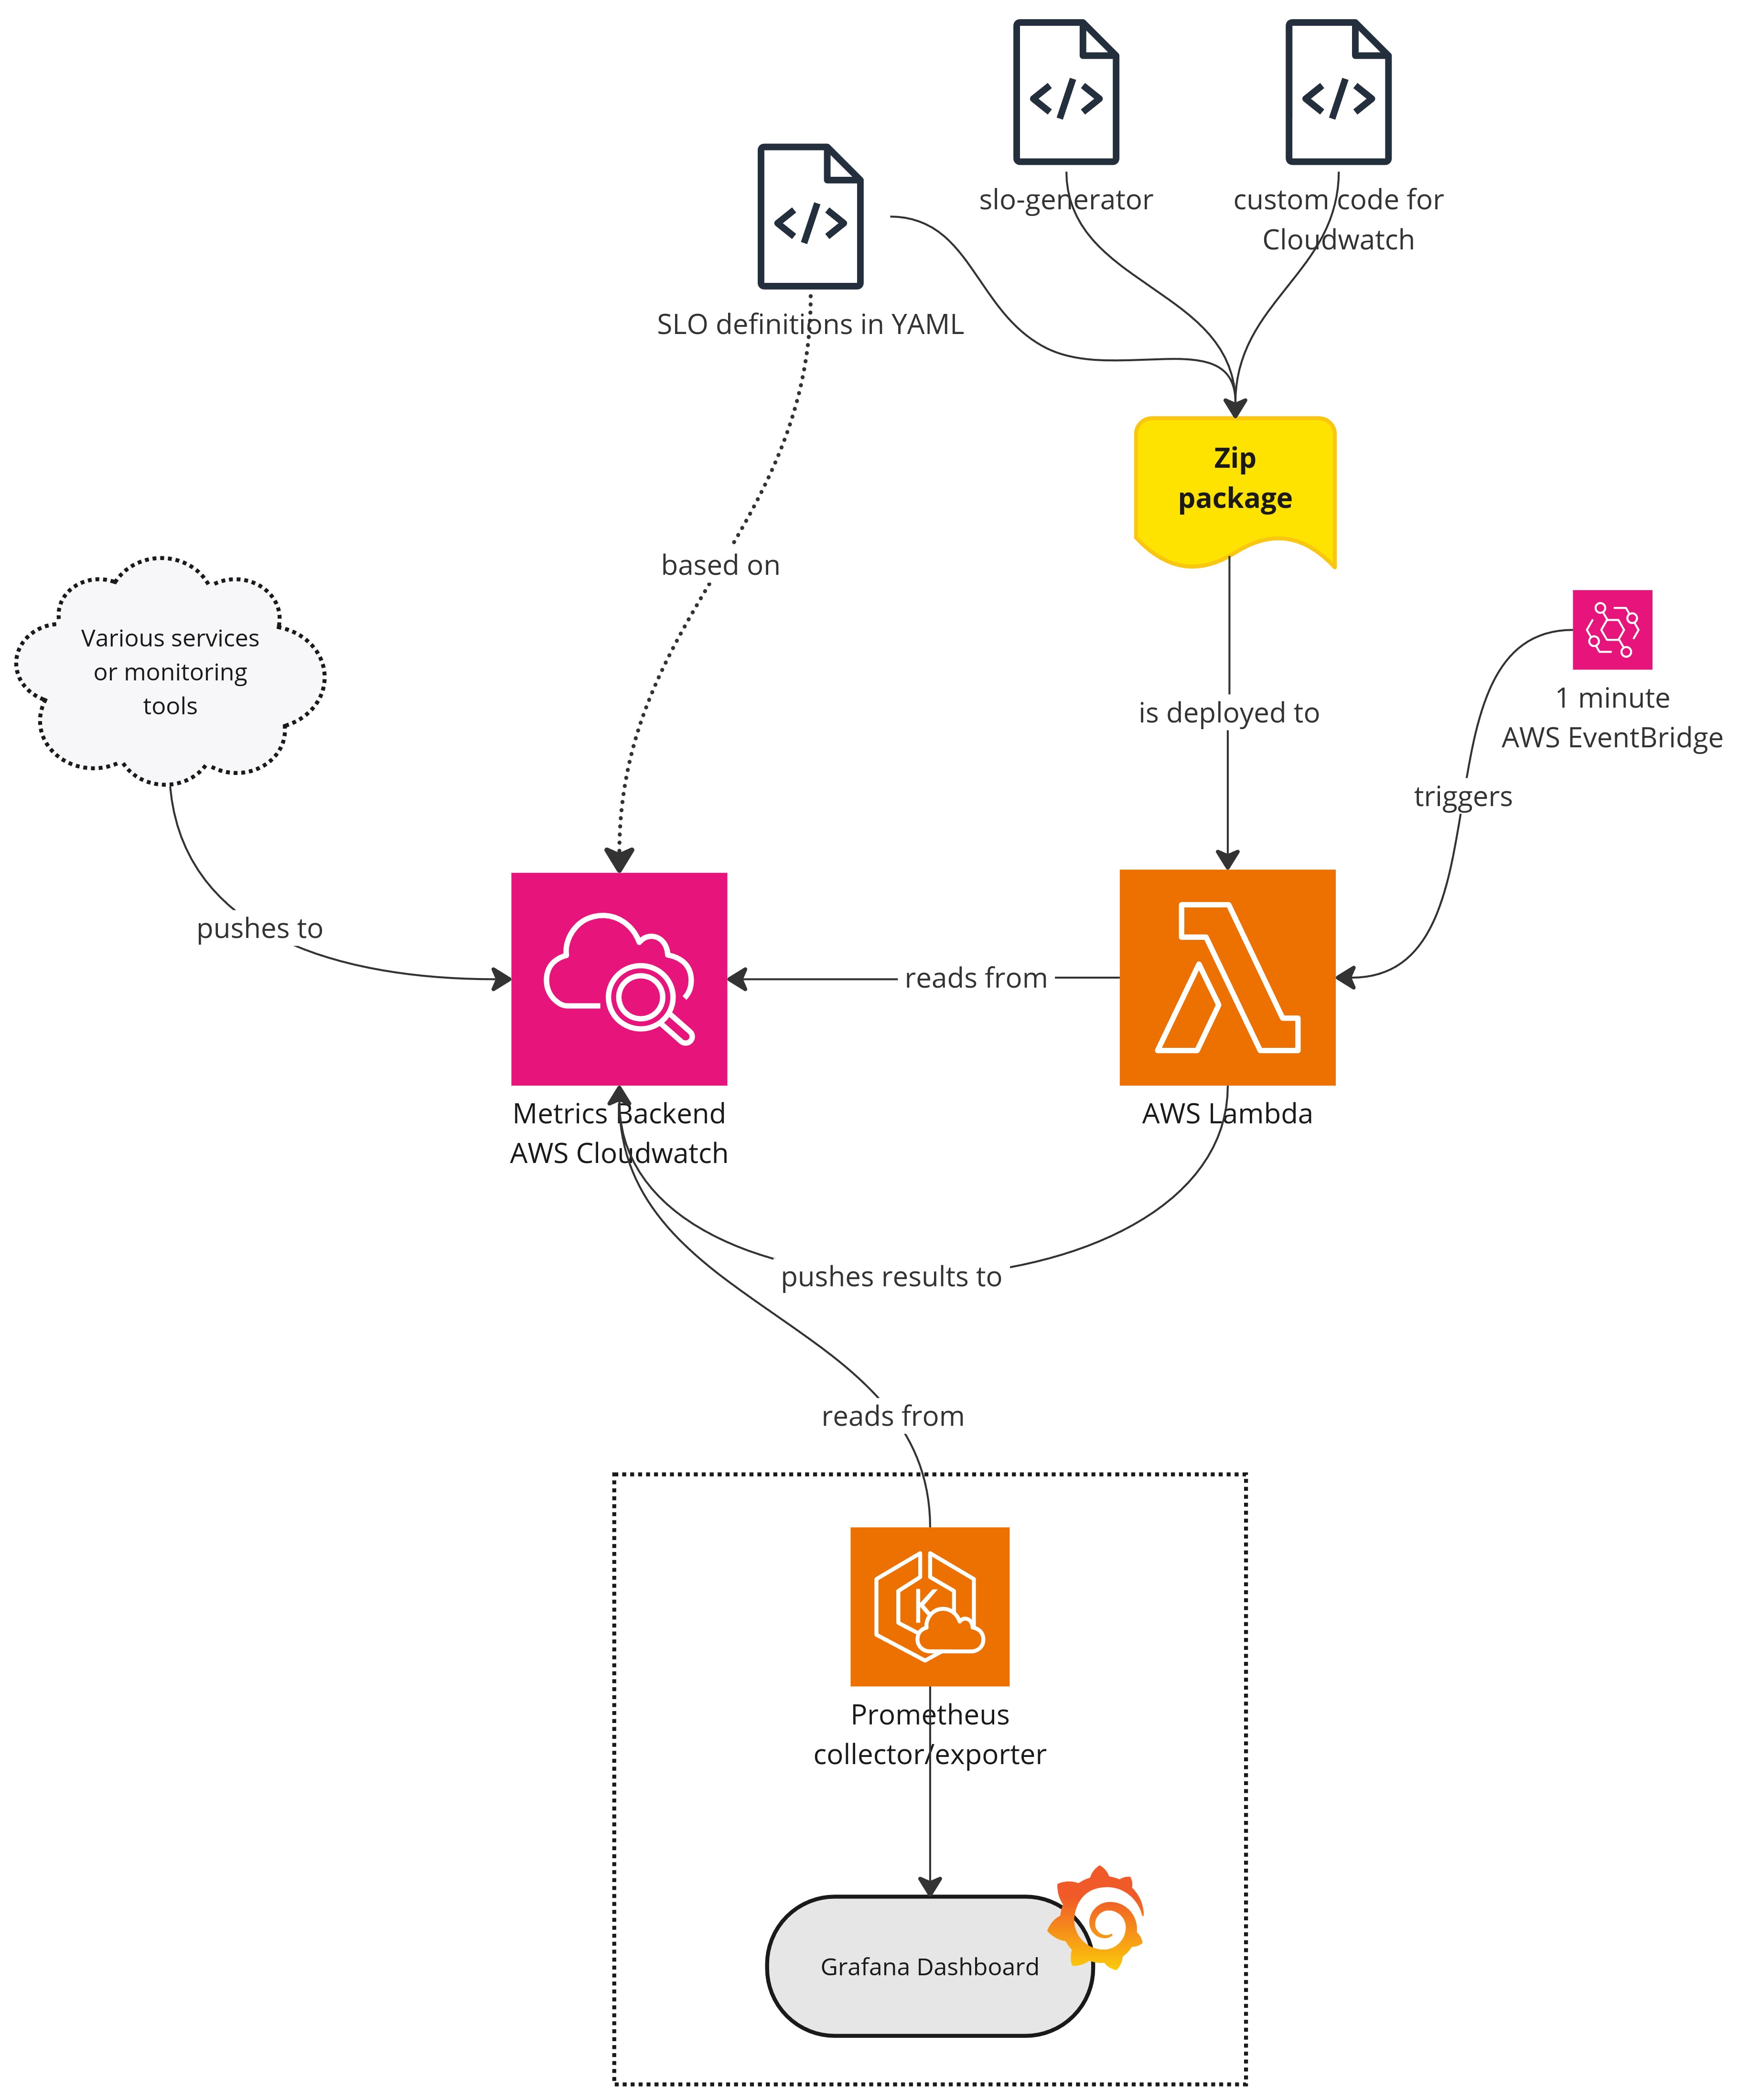 |
|---|
| Architecture diagram of the chosen solution |
If you’re passionate about software engineering, and you would like to work with other developers who are passionate about their work, make sure to check out our careers page and apply to join the team!