In the past few years, our cloud service provider, AWS, has been overall pretty reliable. But like everything in life, nothing is perfect and as Werner Vogels (CTO of Amazon) repeated many times - “Everything Fails All the Time”.
Over the years, we have seen regional outages affecting a subset of the services that we leverage. When those outages occurred, we often relied on another AWS region to quickly spin something up that allowed us to continue delivering our services. About 4 years ago, we delivered our multi-regions feature to reduce latency, and just recently we worked towards leveraging those regions in an active-active way for our search infrastructure. The main driver was to improve resiliency and to handle those outages the same as any given Tuesday.
Before diving in, what is active-active? The idea is to duplicate your infrastructure in two (or more) geographic locations, split the traffic between them and actively handle live traffic using all locations. Health checks are configured to automatically switch the traffic toward the healthy region.
In this post we will explain the following:
- What we focused on for this first phase of the project.
- The compromises we had to make.
- The challenges.
- How we tested the solution.
- How we seamlessly migrated organizations that are active-active.
The Focus
We had 4 main objectives for this project:
- Make our search infrastructure active-active.
- Have automated health checks to trigger failover in case of an outage.
- Add as little extra AWS cost as possible.
- Make this available without asking customers to change their implementation.
Infrastructure
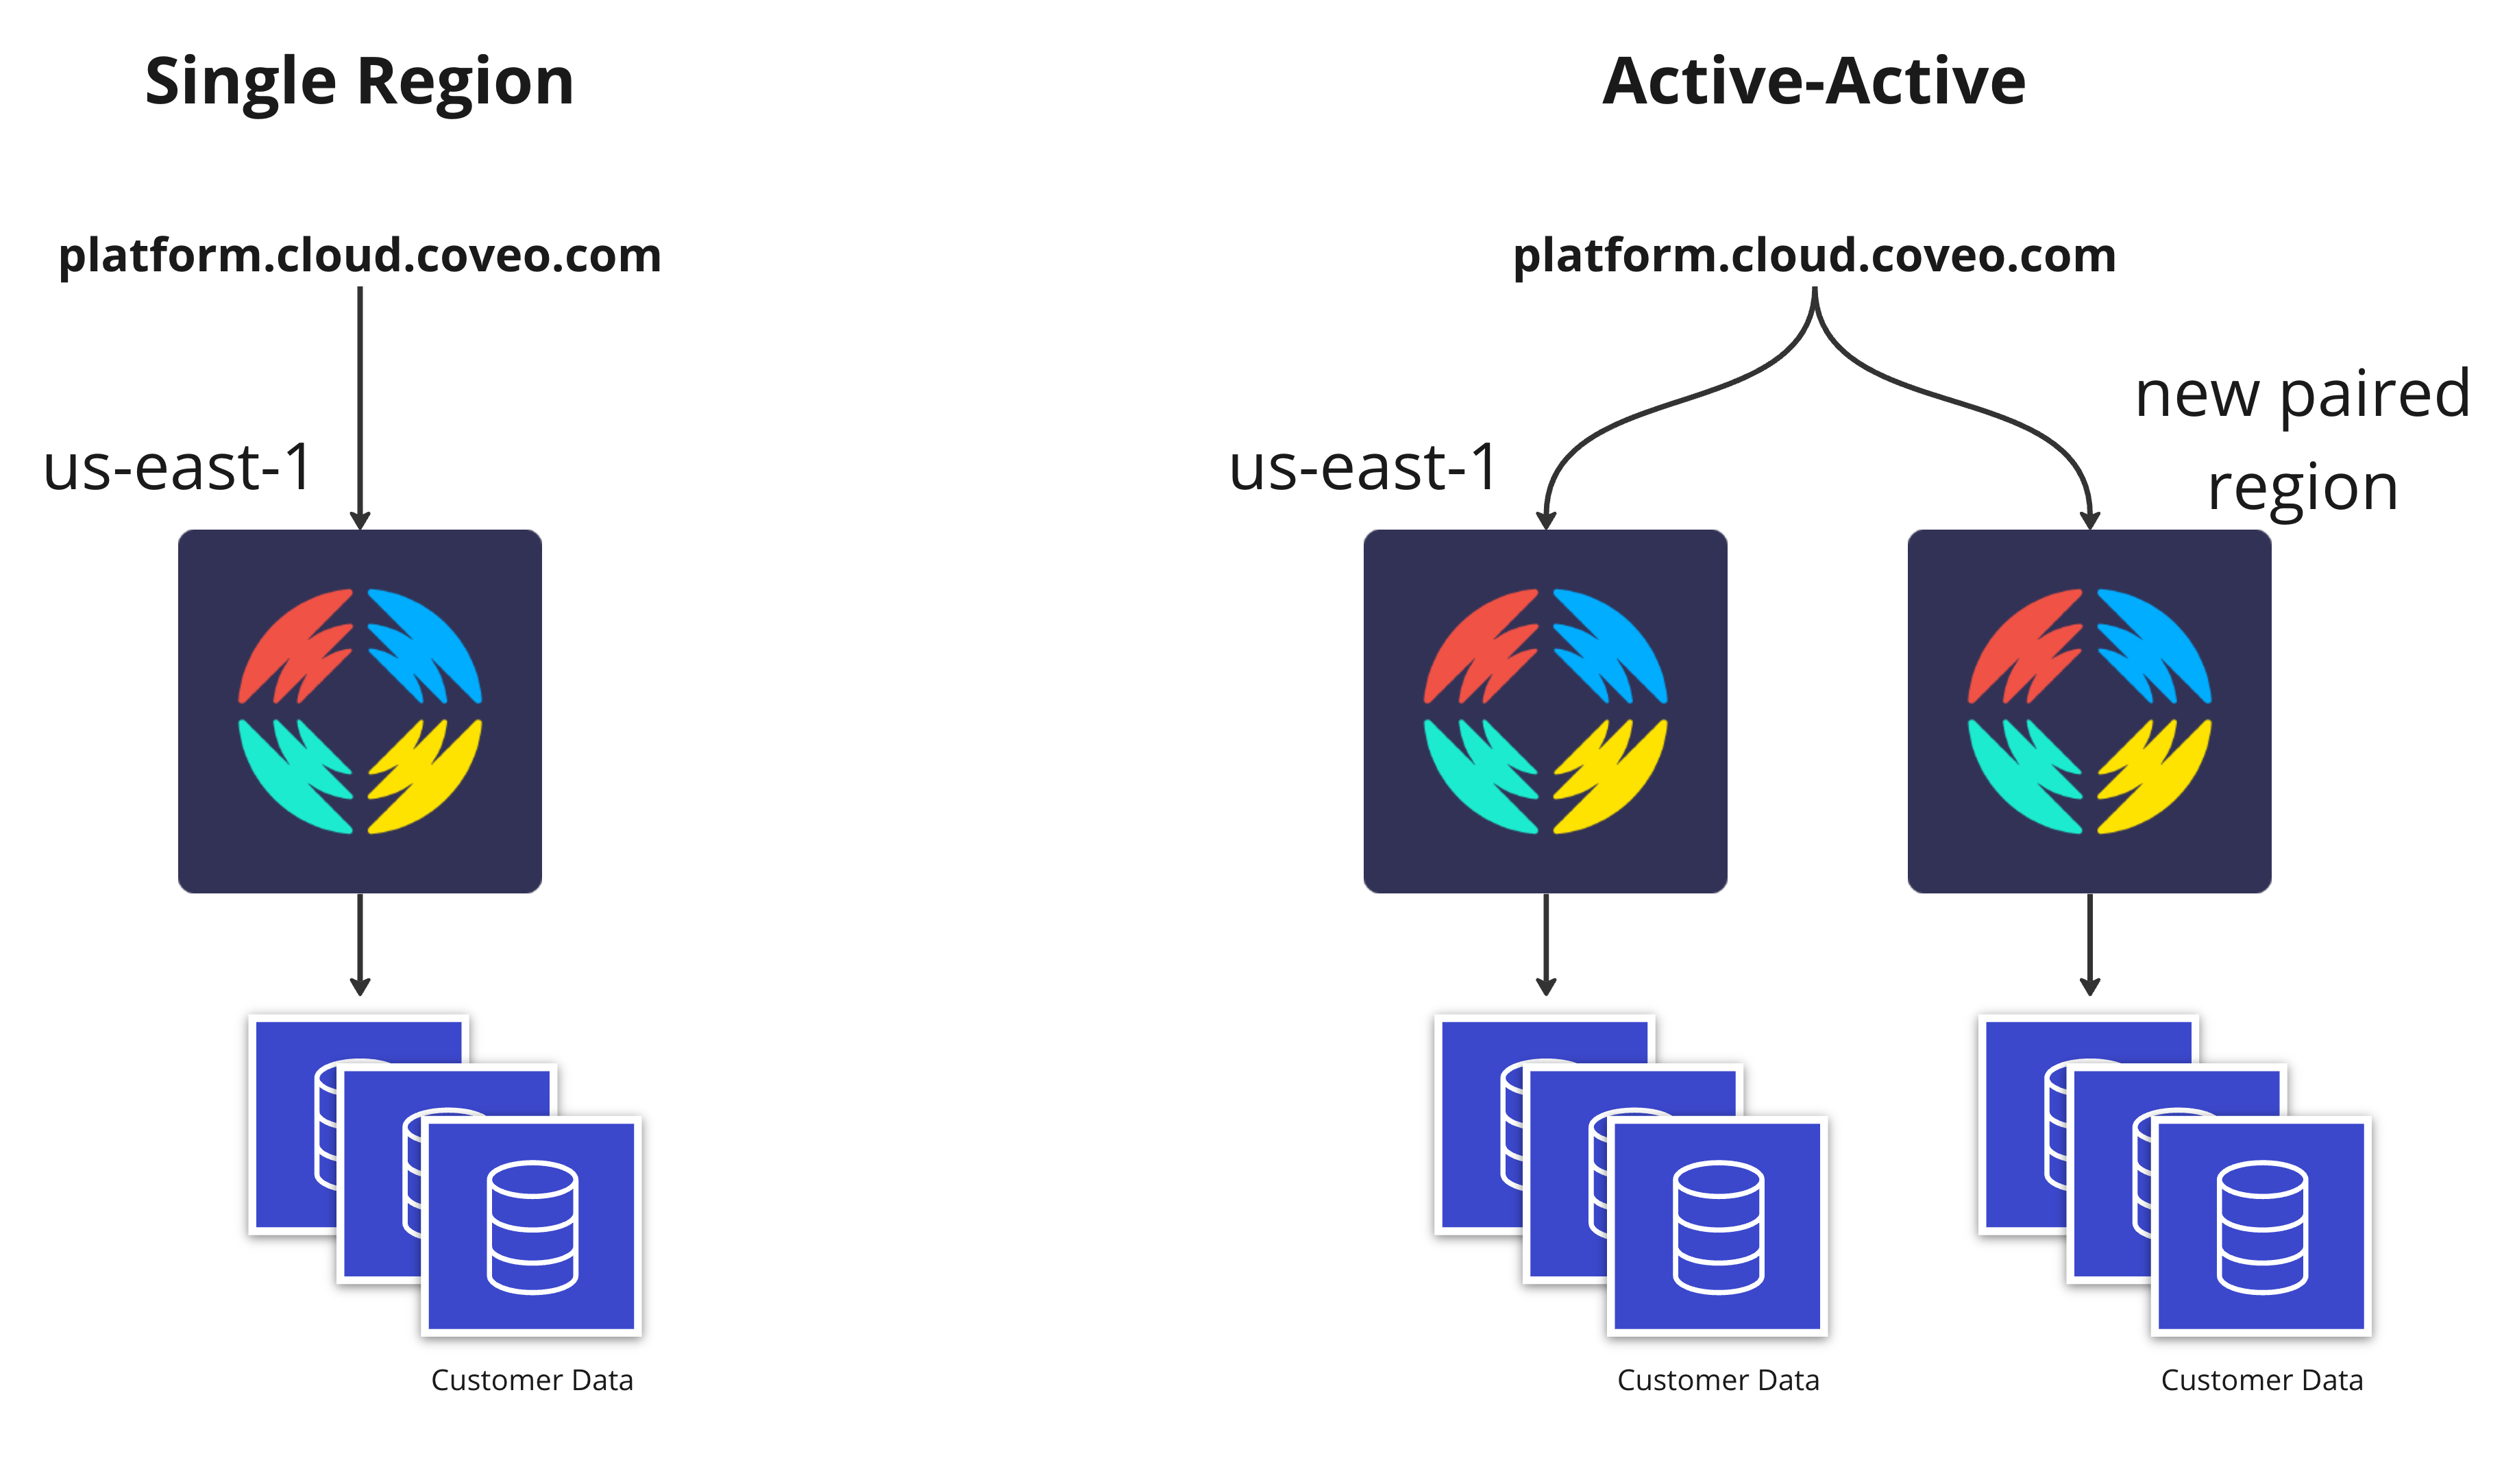
We are committed to delivering outstanding uptimes with a focus on search queries, so our attention was first and foremost on the search infrastructure. This means that in the event of downtime in our main region, everything related to search queries would continue to work but other services might be impacted (i.e., administration console, content ingestion, analytics, etc.). We also focused on our US region, since this is where most of our customer organizations are deployed. In future phases, we are planning to bring this feature to other regions as well.
Most of our infrastructure is multi-tenant, so the goal was to replicate the search infrastructure in two regions and once the traffic is balanced, scale down the initial region. This scaledown means we are not doubling our cost, but of course there is some overhead, so some extra costs are inevitable.
For search, each customer has their own indexes and machine learning models. All production customers already had at least 2 indexes and 2 of each machine learning model for redundancy. Both copies were in the same AWS region in a different availability zone. For active-active, the plan was to move those copies to another region. This allowed us to gain resiliency without significant extra infrastructure costs. Using two regions means we now have additional inter-region traffic transfer fees, so again some extra costs here as well.
Automated Health Checks and Failover
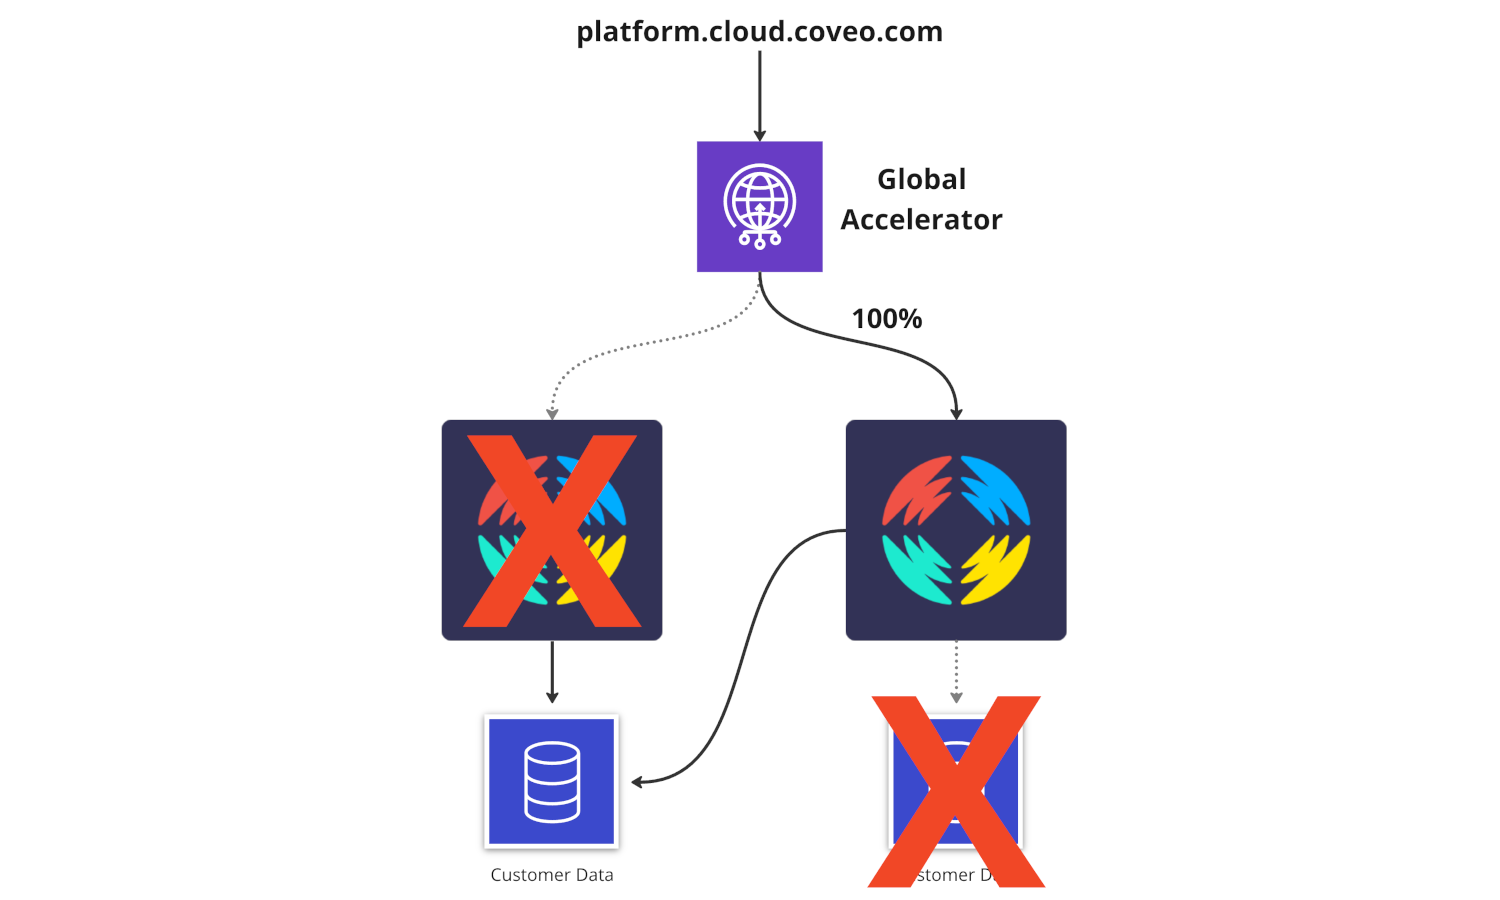
Our initial plan for our automated failover was to use AWS Route 53 traffic policies with a weighted policy to split the traffic between both regions and rely on health checks to automatically ignore a region that would become unhealthy. Since we have little control over how DNS information is propagated, we did not like this solution. Propagation can take several hours since a lot of DNS servers simply ignore TTL configurations. The control plane of Route 53 is also in us-east-1, so it made even more sense to try to use a different solution to manage traffic since this is where our main region is located as well. After talking with our technical account manager from AWS, he suggested that we use AWS Global Accelerator. You can read more details about what the service offers here.
To summarize the part that interested us, Global Accelerator allows configuring each endpoint with their own traffic dials and health checks. This allows us to control very quickly where traffic is sent. During testing, we saw that after editing those dials, traffic can be switched in just a few minutes.
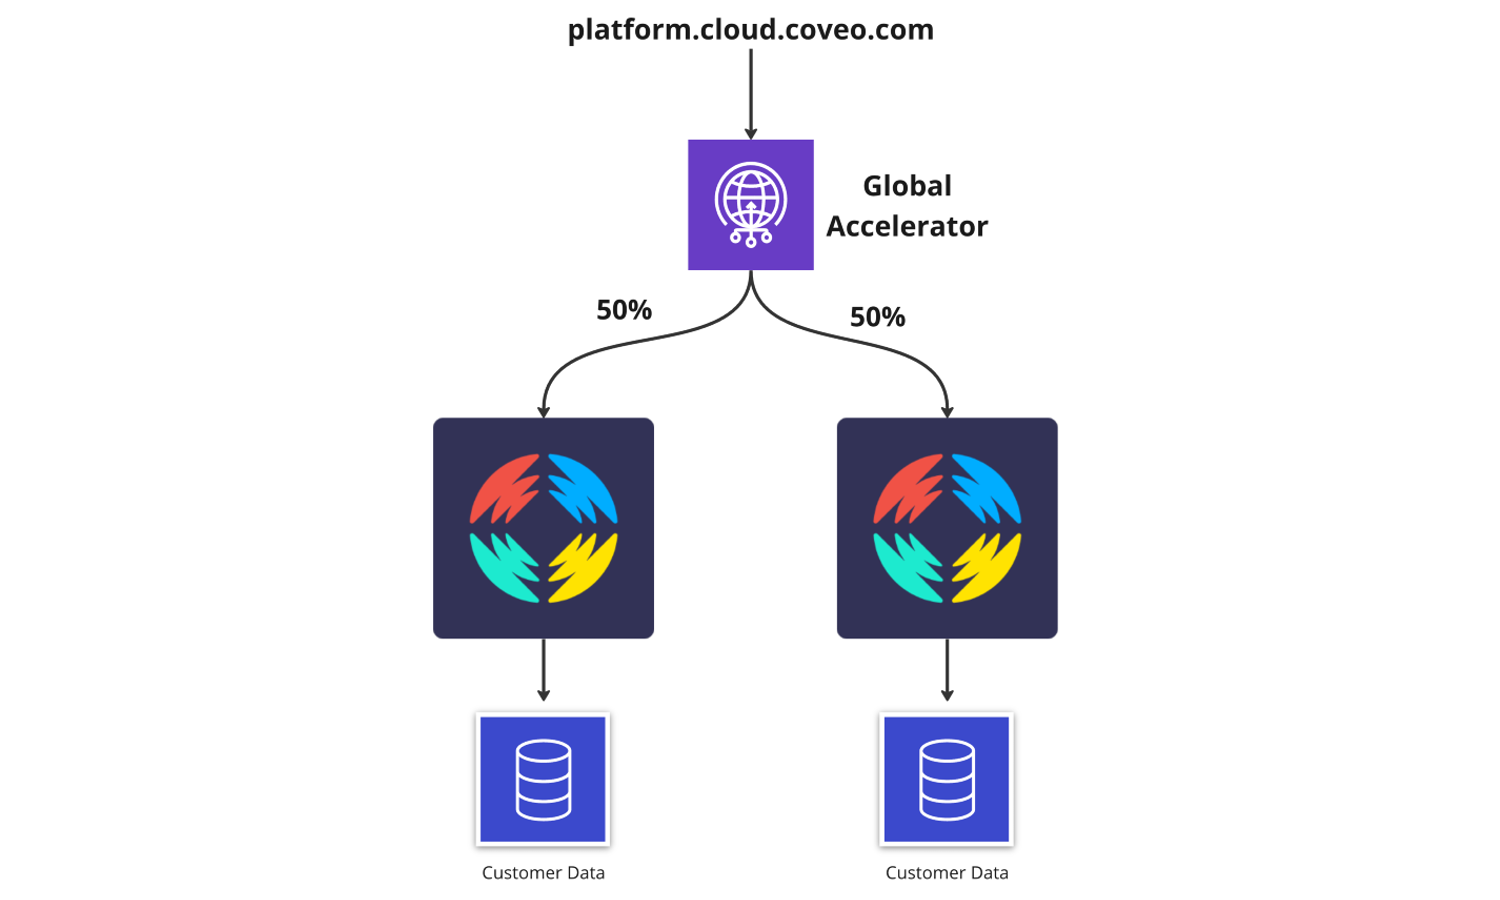
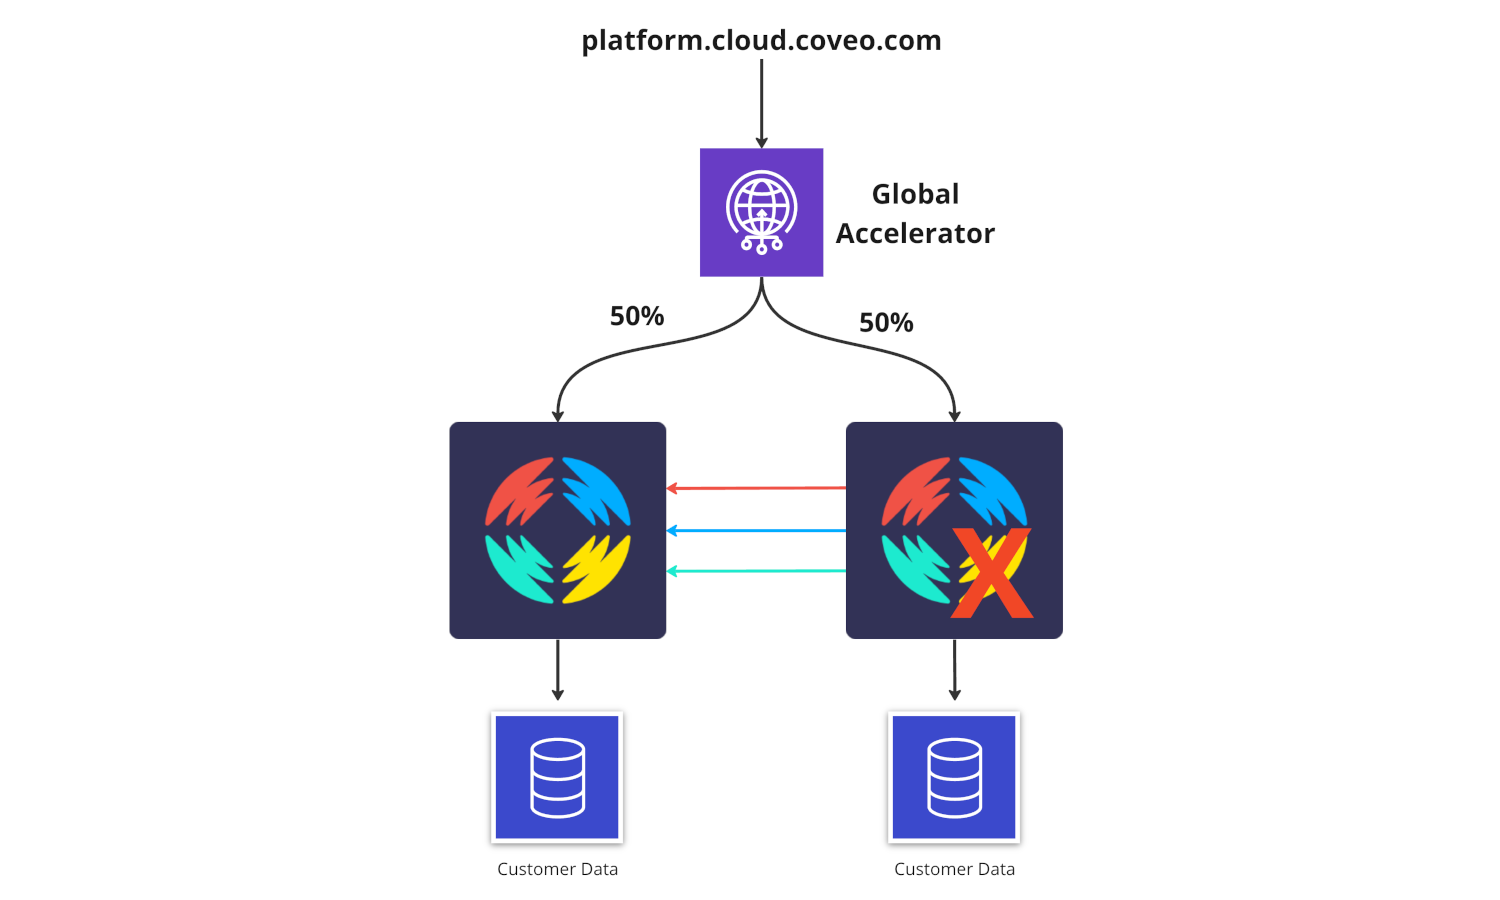
With the traffic dials in global accelerators, we can also force a balance between both regions. Global Accelerator always tries to pick the regions with the lowest latency. When editing traffic dials, you are controlling the percentage of traffic that is sent to the endpoint for a given region. The percentage is applied only to traffic that is already directed to the endpoint/region, not to all configured endpoints.
To help balance things, we can configure the traffic dial of both endpoints to be 50%. This means that 50% of the traffic that is supposed to go to Region A is going there, but the rest is sent to Region B and vice-versa. This will create a very good balance, regardless of which region would have been naturally picked. The downside is that using that configuration will add some extra latency for 50% of your calls. We will talk about latency later in this post.
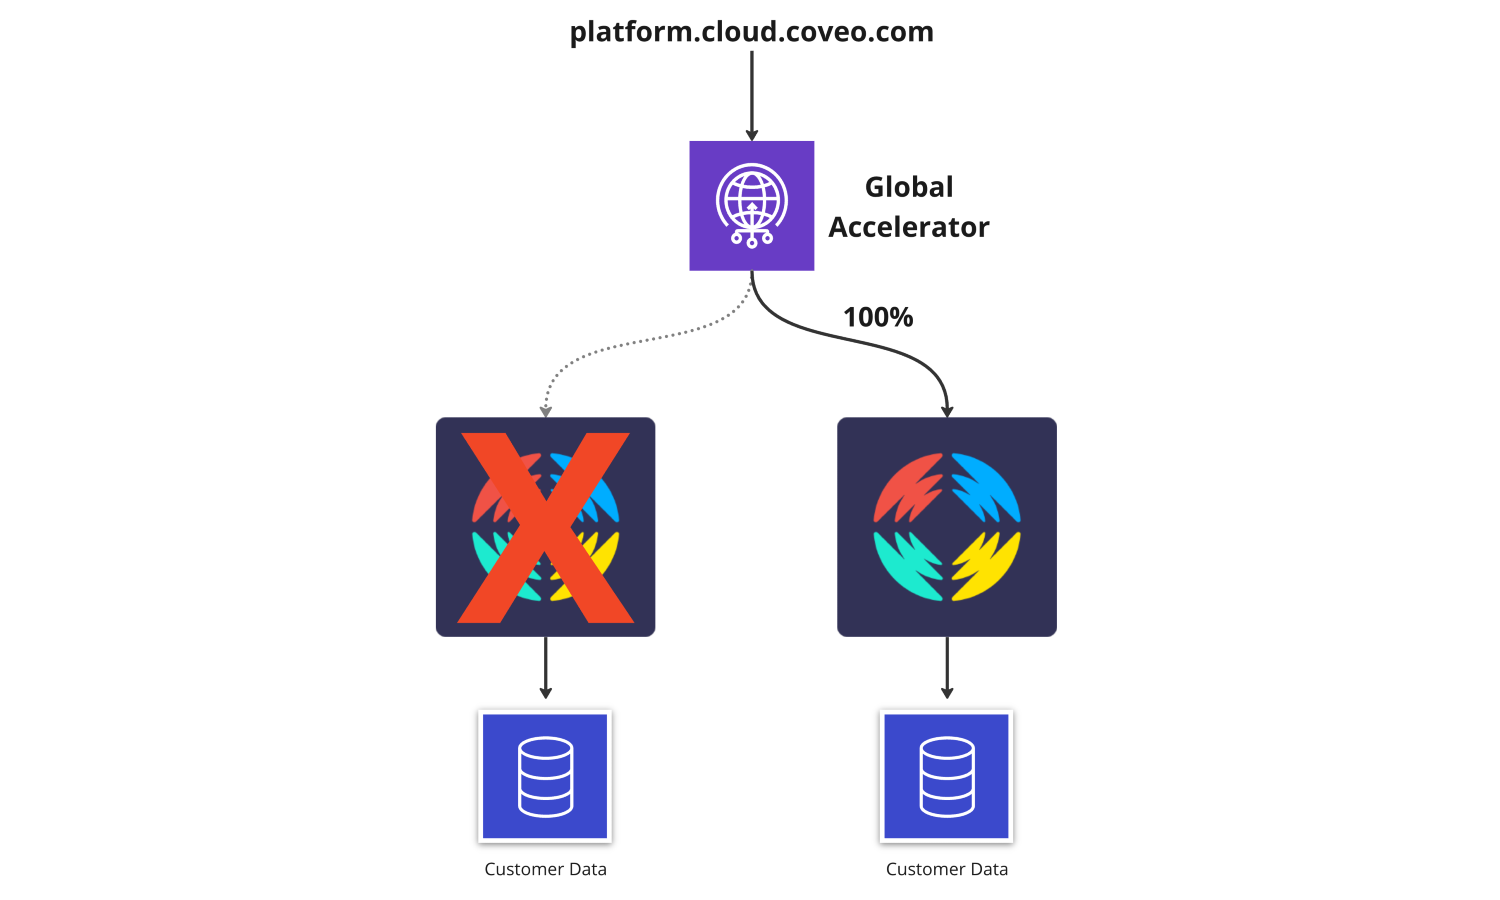
In Global Accelerators, you can also configure a health check on each endpoint. If an issue occurs, the traffic will automatically shift to the healthy region.
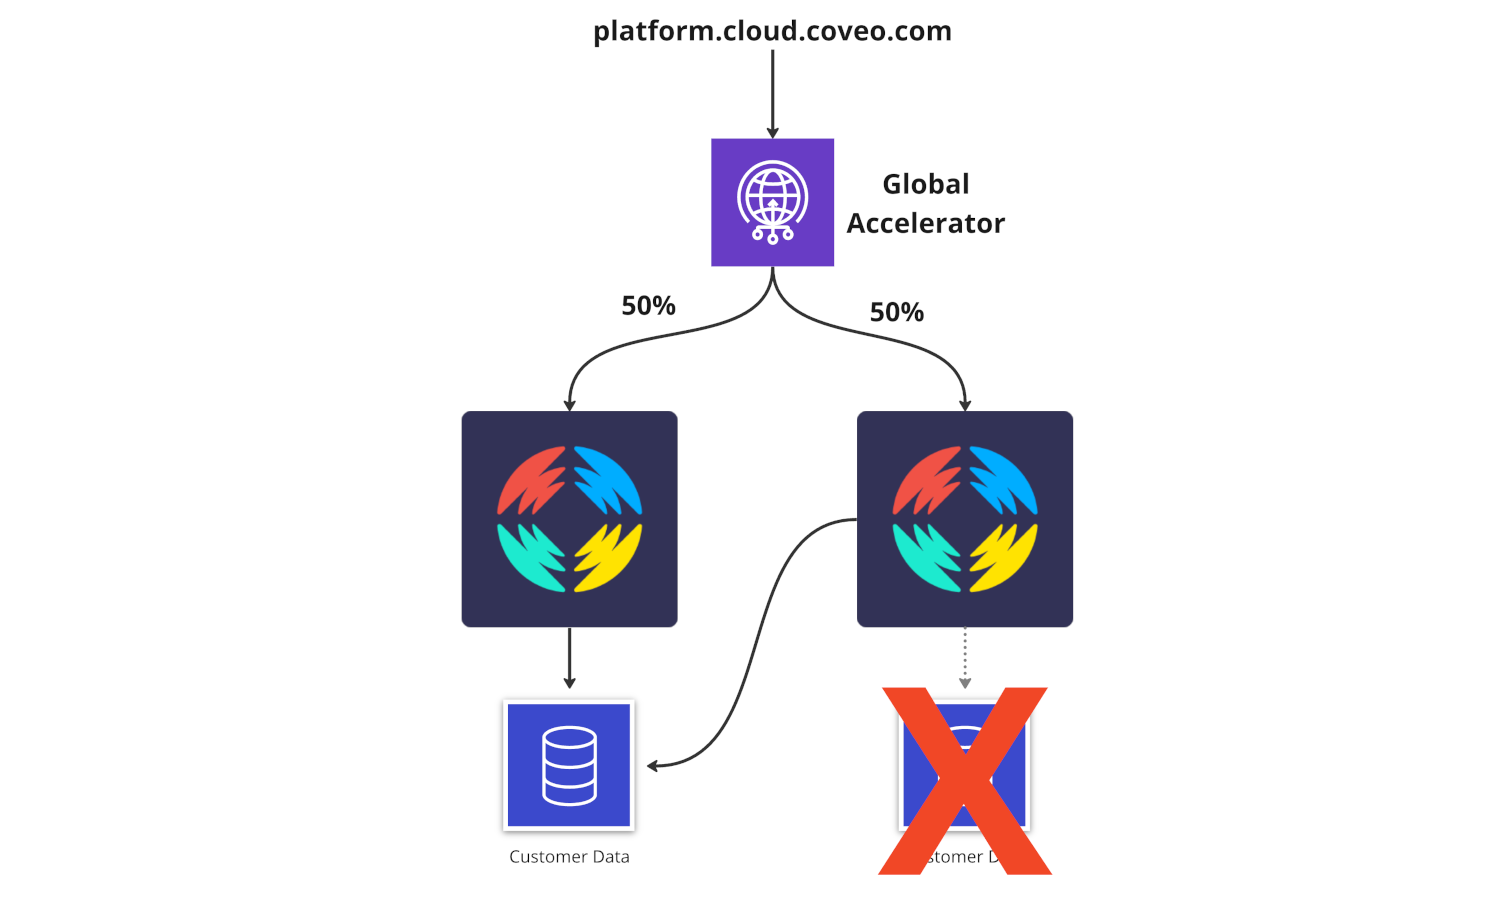
Finally, the service taking care of querying customer indexes and machine learning models in our backend is also able to use both regions. If an index in region A is unavailable, the service in region A will use the index from region B.
It was pretty awesome to see the reactions of our QA engineers when they first encountered those fallbacks. Some test cases that used to fail were now perfectly working even if something was intentionally stopped or if some faults were injected by the QA engineers themselves.
The Challenges and Compromises
Data Synchronization
During the development, we faced some interesting challenges about data synchronization. Making sure both regions use the same data with as little lag as possible was one of them.
For instance, our machine learning team had to replicate DynamoDB tables that represented about 6 terabytes of data in the new region. Those tables received on average 125 updates per second, we had to do this while production was still live and with no downtime. We could not rely on global tables, because once the migration was completed, those tables would be independent. We still needed to have the same data as a starting point to make sure we didn’t start with an empty region.
We also had to make sure our applications were using the same data from RDS databases. For some services, we were able to leverage RDS Aurora Global database. For other services, we were not ready to properly support a local reader instance and separate writer instance so we had to make a compromise. Applications running in the new paired region are still using the database from the primary region, but to be resilient we also have a read replica in the new region that is not used. This will allow us to make quick failovers in case of a major disaster in the primary region with just a small configuration change. Of course, we will work on that part to make use of the reader instance and not have to worry about manual steps in case of issues.
Inter-Service Traffic Routing
Making our inter-service traffic use both regions to be more resilient was also a very good challenge to solve. We wanted any services in our backend to make use of the paired region as much as possible, even if that service was not part of the search infrastructure. We always prefer to use services in the same region, but we’ve added logic to use other regions when possible. For example, if a service deployed in both regions becomes unavailable in one region, instances trying to contact that service will start using the other region.
Region Selection for the Paired Region
The goal of the project was to have traffic balanced between regions as much as possible. This balance would help us scale everything appropriately without thinking too much about it.
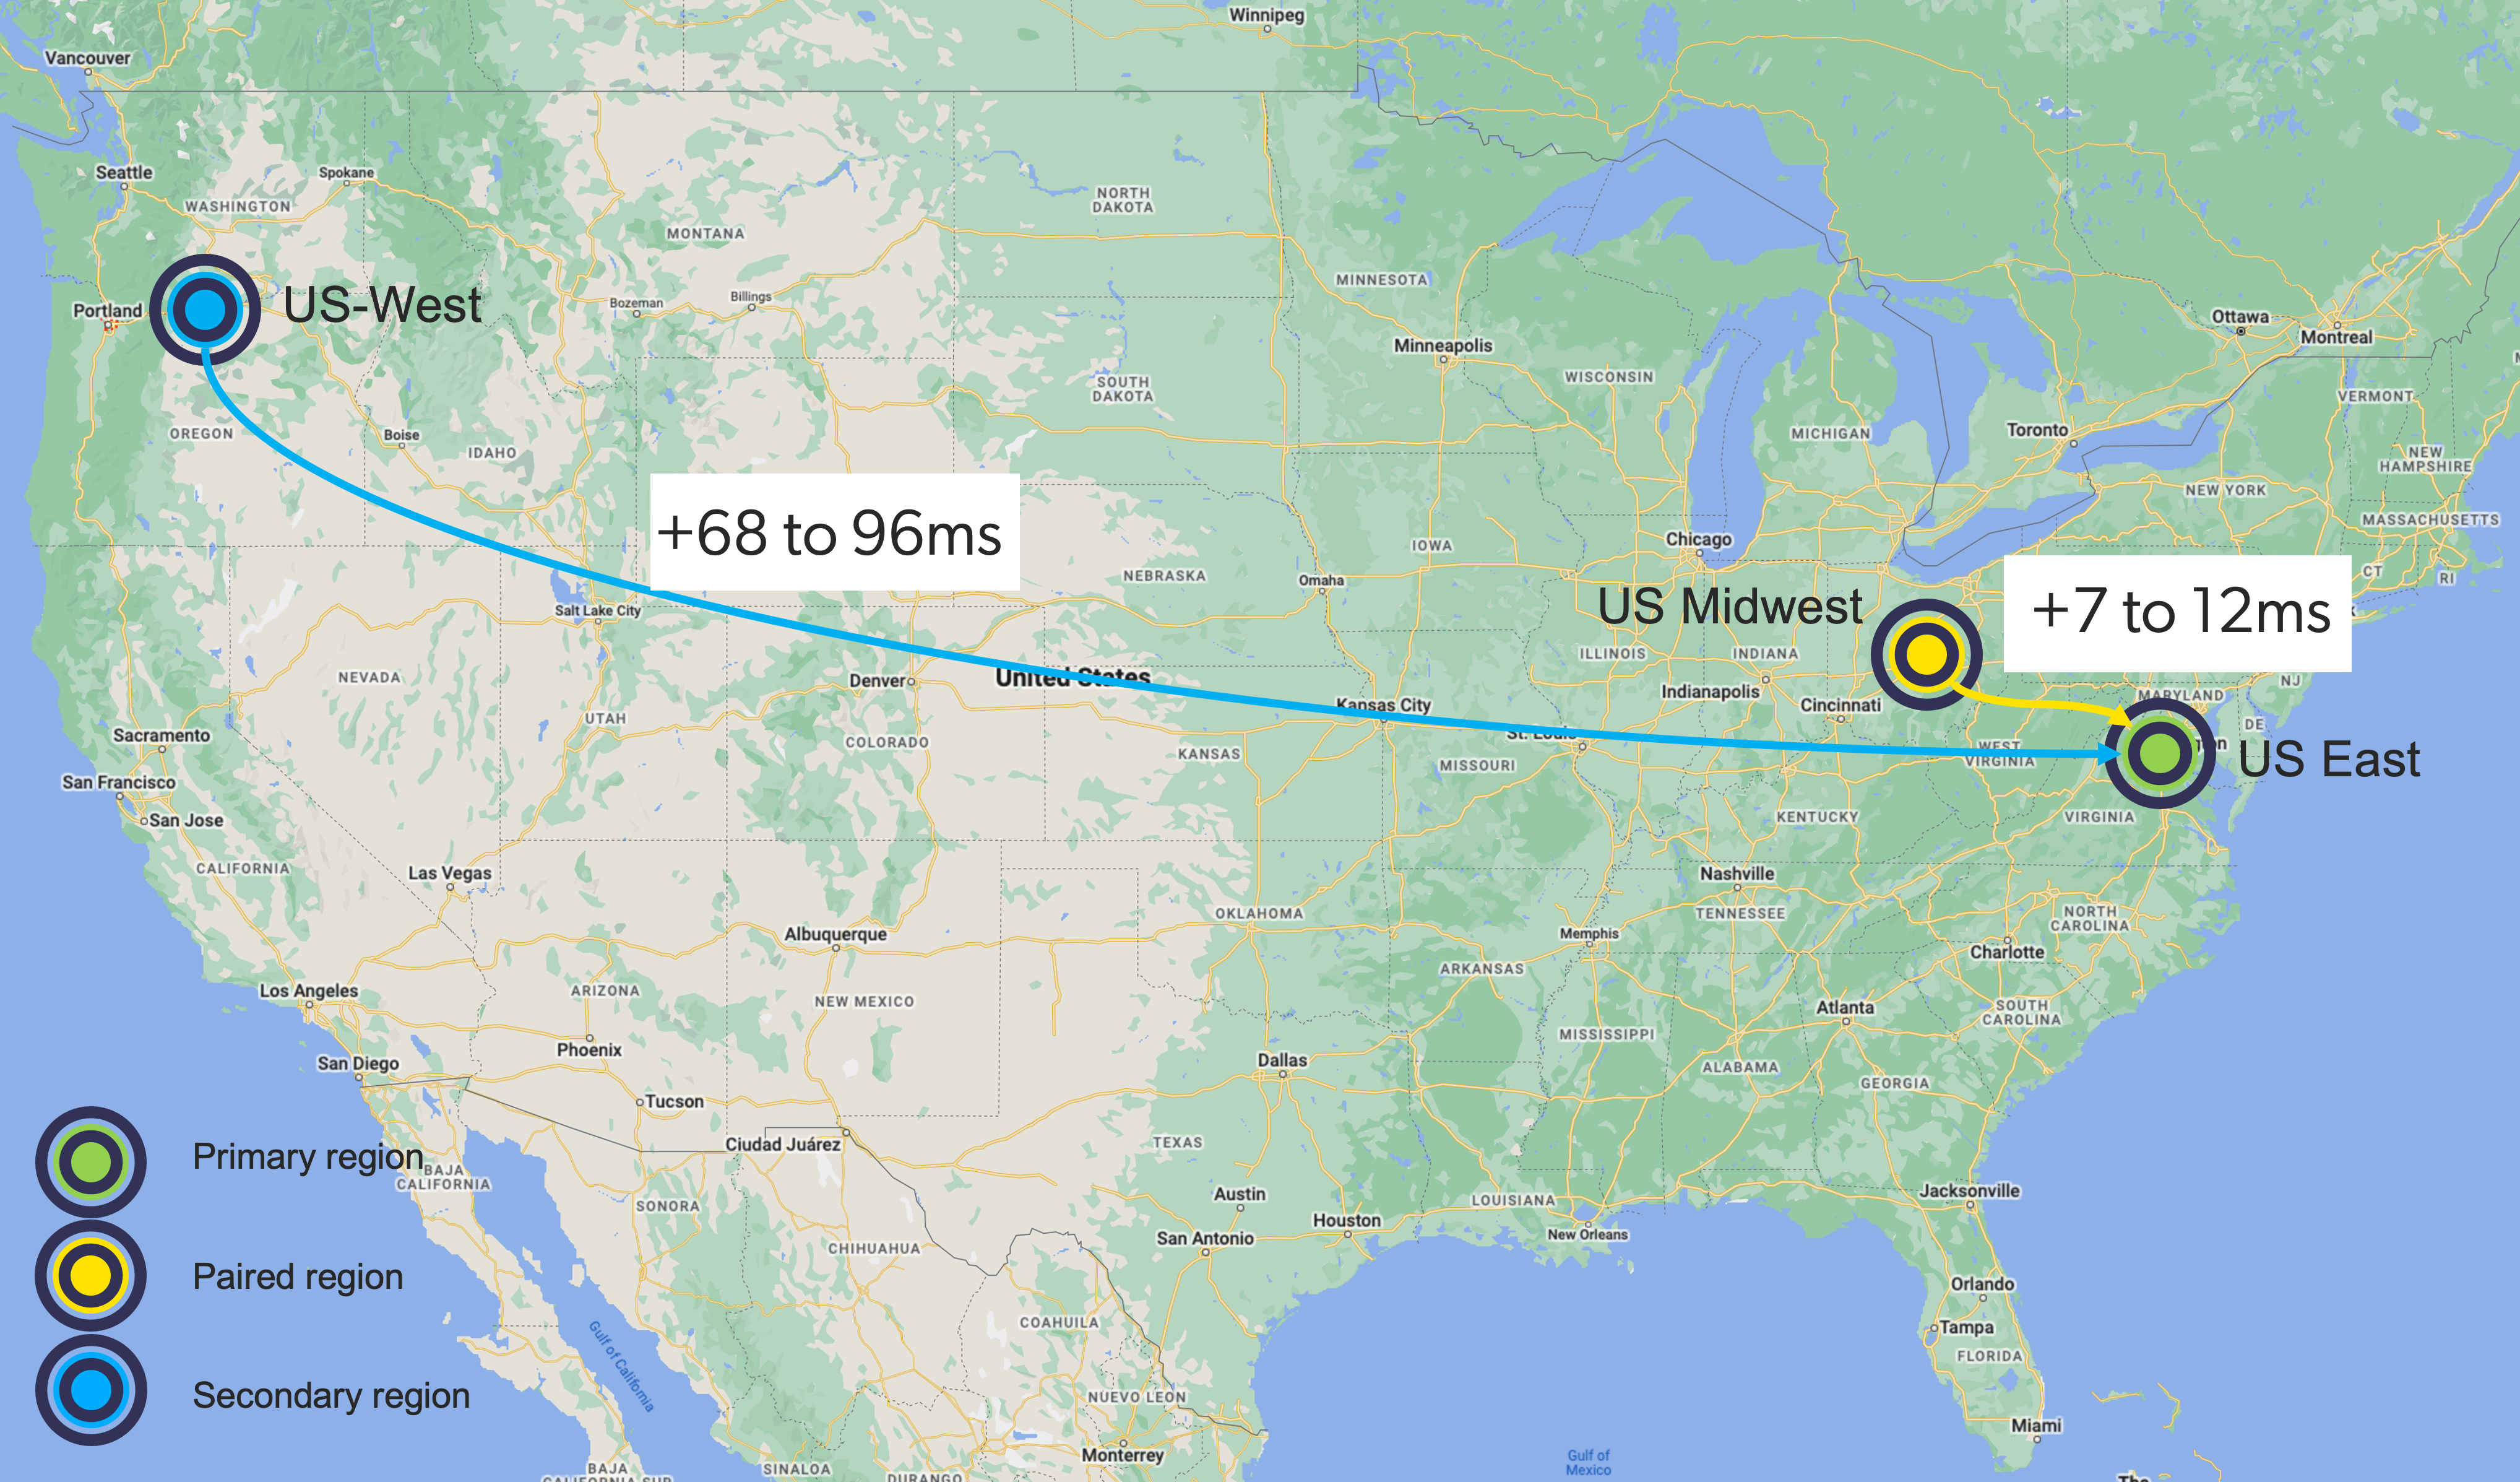
Our initial idea was to use us-west-2 in Oregon as the paired region for 2 reasons:
- We already had infrastructure deployed there
- We thought serving the east and west coast would help us balance the traffic.
After doing some tests we found out that there would be a lot of added latency for all customers that are not active-active.
Since we want to make this feature available without any customer modification, our platform.cloud.coveo.com endpoint will now split all our traffic.
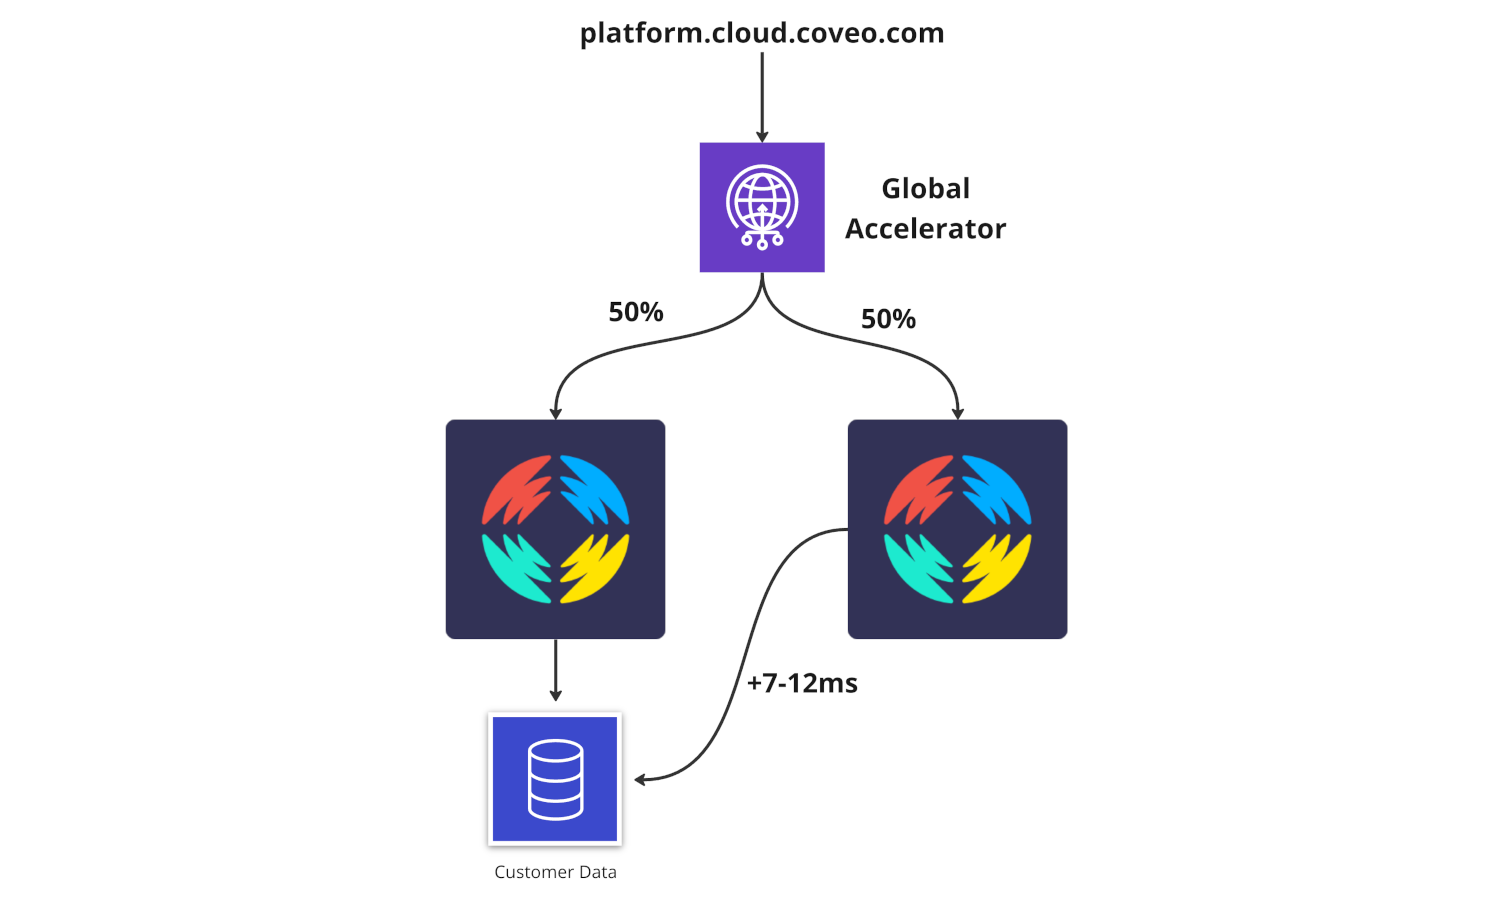
To minimize the added latency, we decided to pick an AWS region that is physically closer to us-east-1. In the end, we decided to go with us-east-2, located in the Midwest. The added latency when calls are bouncing between regions is almost negligible. Only 7-12ms are added when calls are forwarded to the other region, compared to 68-96ms when using us-west-2.
We also verified that those 2 regions were really independent, if something occurs in one region the other one will not be affected. [Ref]
How we Tested the Solution
During the development phase, we created an active-active region setup in our dev environment. This allowed us to quickly iterate and start adding all the pieces that were needed to bring this project to life. Our chaos engineers were able to set up dashboards showing us whether a request was answered properly. It would also show from which region it was sent and whether the expected region answered it.
We created some test scenarios that were causing various outages. Scenarios included:
- Simulated AWS services not working as expected
- Internet facing load balancer failing
- Cluster nodes running into network or DNS issues
- Micro-service outages
- Customer index failing
During each test, we monitored how our platform reacted to those outages. Over the weeks, we could see our progress. It was really motivating to see that more and more test scenarios were now supported and that our platform would continue working during those outages. It also allowed us to detect issues or slowness in reaction to an outage. Our goal was to have a fallback response within at most 5 minutes of an issue. We were able to achieve and even surpass that target in most scenarios. Our current worst case scenarios recover on average in 2 minutes. We will be working toward automating those tests as much as possible to make sure we can catch any regressions and avoid detecting those during a real outage in production.
Migrating Production
We did the migration in several steps. We decided to start with some of our biggest customers that were going to be active-active. We picked the ones sending us the most traffic. The idea was that for the first set of organizations, we were able to gradually modify traffic dials and slowly increase the traffic in the new region. Once those dials are set, we cannot really modify them without impacting migrated customers.
We started by confirming our infrastructure in the Midwest was able to receive and forward traffic to us-east-1 when needed. All non active-active organizations are relying on this cross-region forwarding so it was critical to validate this component.
We replicated all the necessary data in the new paired region for the first customers. Once everything was ready, we modified our platform.cloud.coveo.com` record to use a global accelerator with both regions. Traffic dials were initially set to 1% in the Midwest and 100% in us-east-1. Over a day or so, we gradually increased the Midwest dial to reach 50% while leaving us-east-1 to 100%. During this first step, we found 2 minor problems and had to roll back traffic out of the region while we were fixing things, those issues did not impact the search infrastructure. After 2 days we got to a 50-50 split between both regions. This graph below shows the gradual increase in traffic as well as the rollback.
The graph shows that the original region has more traffic than the new one. This is explained by the fact that all analytics traffic is still only in one region. To finalize the migration, we picked organizations that needed to be migrated by batches, copied their data in the new region, waited for everything to be ready and allowed traffic in the region. Overall, no production organization had search downtime during the migration, which in itself is a great success. Our monitoring showed us the issues, and we were able to quickly rollback while a fix was worked on.
Conclusion
While the project took a bit longer than anticipated, our search infrastructure is now active-active and our goal of improving the resiliency for our platform was achieved. We also kept costs under control and very little latency was added following those changes. We were also able to deliver this feature without asking our customer to modify their implementation.
It’s never easy to estimate how long a project will take. One thing we want to keep in mind for future projects like this is the amount of time that ended up being needed to properly simulate, test outages and find solutions when the system was not recovering fast enough. Focusing on this part earlier in the project would have helped us deliver the project faster.
I hope you found this post interesting!
Thanks to Frédéric Boutin, Jean-Philippe Marceau, Marc Sanfaçon and Jacques-Étienne Beaudet who were kind enough to review this blog post.
If you are looking to solve challenges like the one described above make sure to check out our careers page and apply to join the team!