There is an old adage that says, “Hardware eventually fails. Software eventually works.” As the Coveo Blitz competition is approaching, we are ramping up the platform to receive more than 135 participants who will produce software bots that fight against one another for the prestigious Coveo Cup. One of the cool features of the platform, that we’ve created and improved over the years, is the ability to visualize past fights by downloading a replay file.
But this year, like every year, was different. This year, the replays were up to 50MiB large and the download time was suffering from it. By suffering I mean 50 seconds to download 40MiB; waiting for a mp3 to download in the 2000’s kind of suffering. The replays are stored in S3, proxied by our servers written in go, so let’s see what is going on in the go code, and maybe it will eventually work!
At this point, the more astute will have noticed that a better solution, instead of proxying the download, would instead be to provide a redirect to a presigned S3 url and you would be right, but since I had some free time during the holidays and I wanted to work on something fun, I decided to dive and try to solve this issue.
I also had some CORS errors when I initially tried to use the presigned URL and I’d rather shove my head through a wall than diagnose those kinds of problems, so FUN TIME IT IS INSTEAD!
What exactly is slow?
What’s pretty cool with go is that they offer some great tools straight out of the box to diagnose performance problems.
- Setup a pprof endpoint In our case, since we already had an http server going, we had to add the endpoints:
	import (
	"expvar"
	"net/http"
	"net/http/pprof"
	)

	func Profiler() http.Handler {
	r := http.NewServeMux()

	r.HandleFunc("/pprof/", pprof.Index)
	r.HandleFunc("/pprof/cmdline", pprof.Cmdline)
	r.HandleFunc("/pprof/profile", pprof.Profile)
	r.HandleFunc("/pprof/symbol", pprof.Symbol)
	r.Handle("/pprof/block", pprof.Handler("block"))
	r.Handle("/pprof/heap", pprof.Handler("heap"))
	r.Handle("/pprof/goroutine", pprof.Handler("goroutine"))
	r.Handle("/pprof/threadcreate", pprof.Handler("threadcreate"))
	r.Handle("/vars", expvar.Handler())
	r.HandleFunc("/", func(w http.ResponseWriter, r *http.Request) {
		http.Redirect(w, r, r.RequestURI+"/pprof/", 301)
	})

	return r
	}
- Run a performance test. My favorite tool for this is called Vegeta, and yes it’s mostly based on the cool name / command line. The tool is also great :)
echo “GET https://blitzserver/game/49900/replay” | vegeta attack -rate 1 -duration=60s | vegeta report - Run pprof
go tool pprof -http=":7777" https://blitzserver/debug/pprof/profile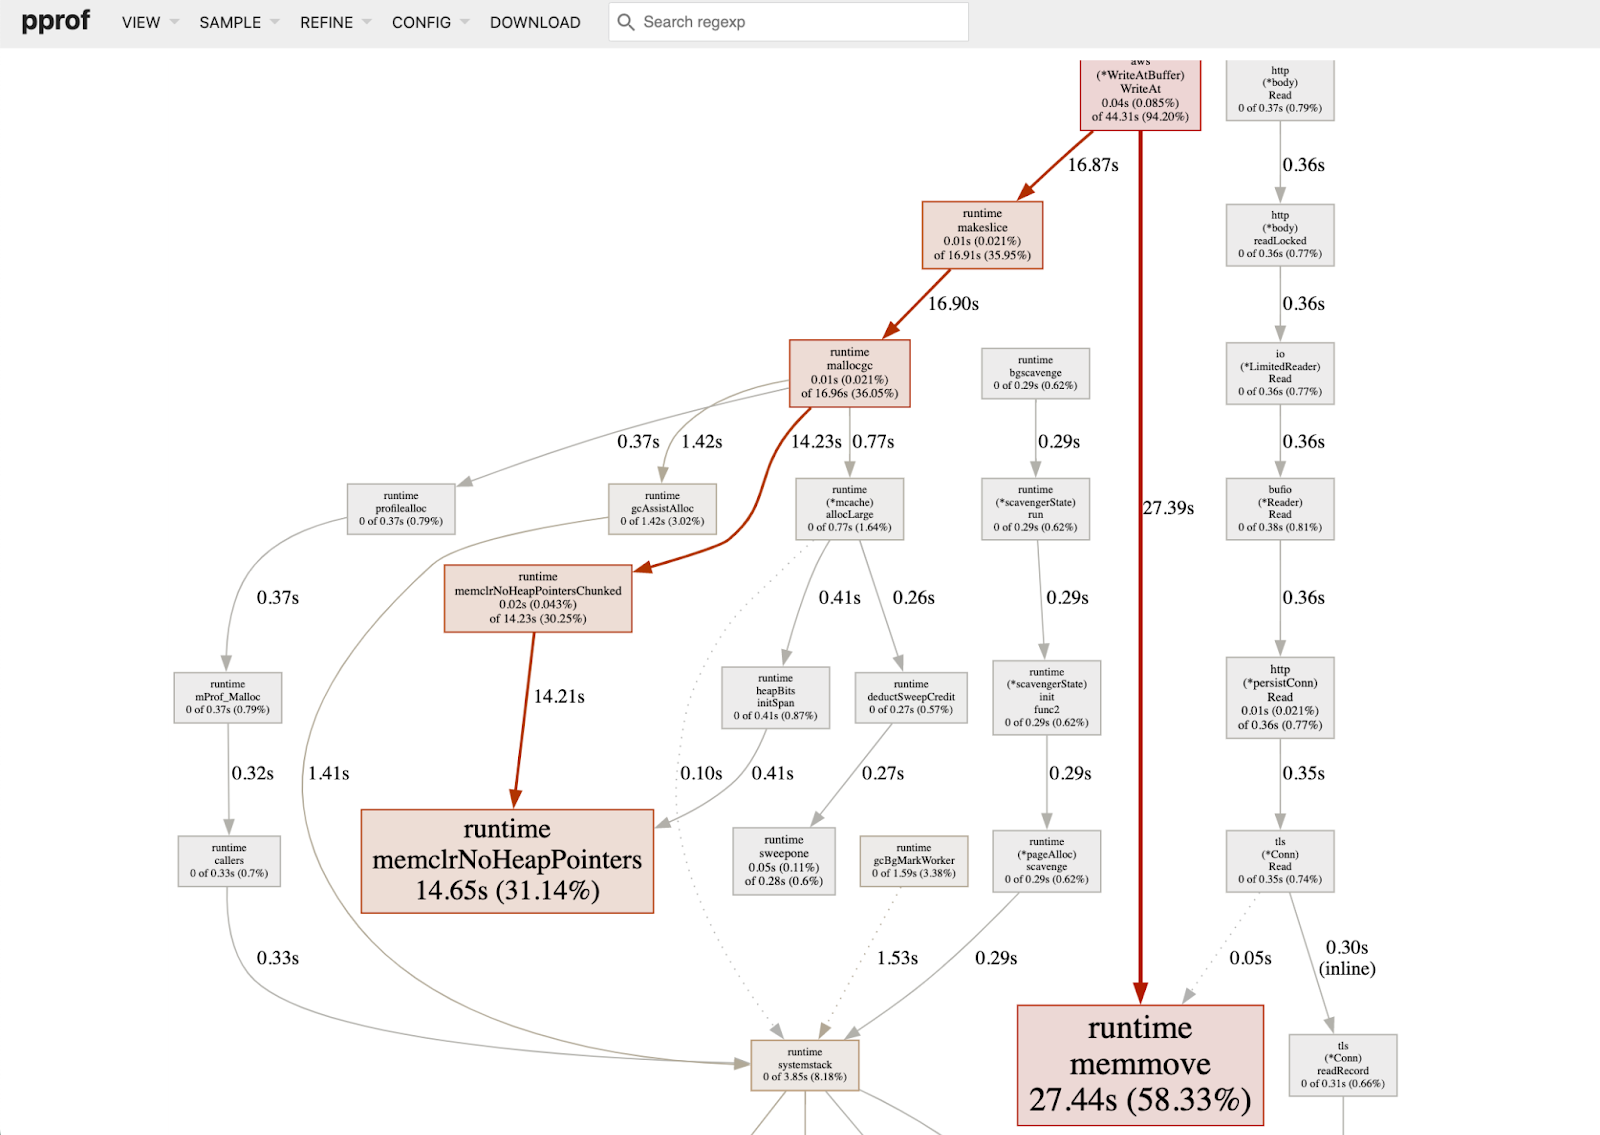
As I shared this, my colleague Felix Pelletier immediately claimed: “There is a strong buffer reallocation stench coming from those graphs”.
We’re going to need a bigger buffer?
Now we have 2 pieces of information: an idea of which part of the code is contributing to the problem, and a good tip from our colleague on what might be going on. We’re also very lucky as we have instrumented our code with telemetry which we visualize in Honeycomb, allowing us to confirm our profiling with tracing.
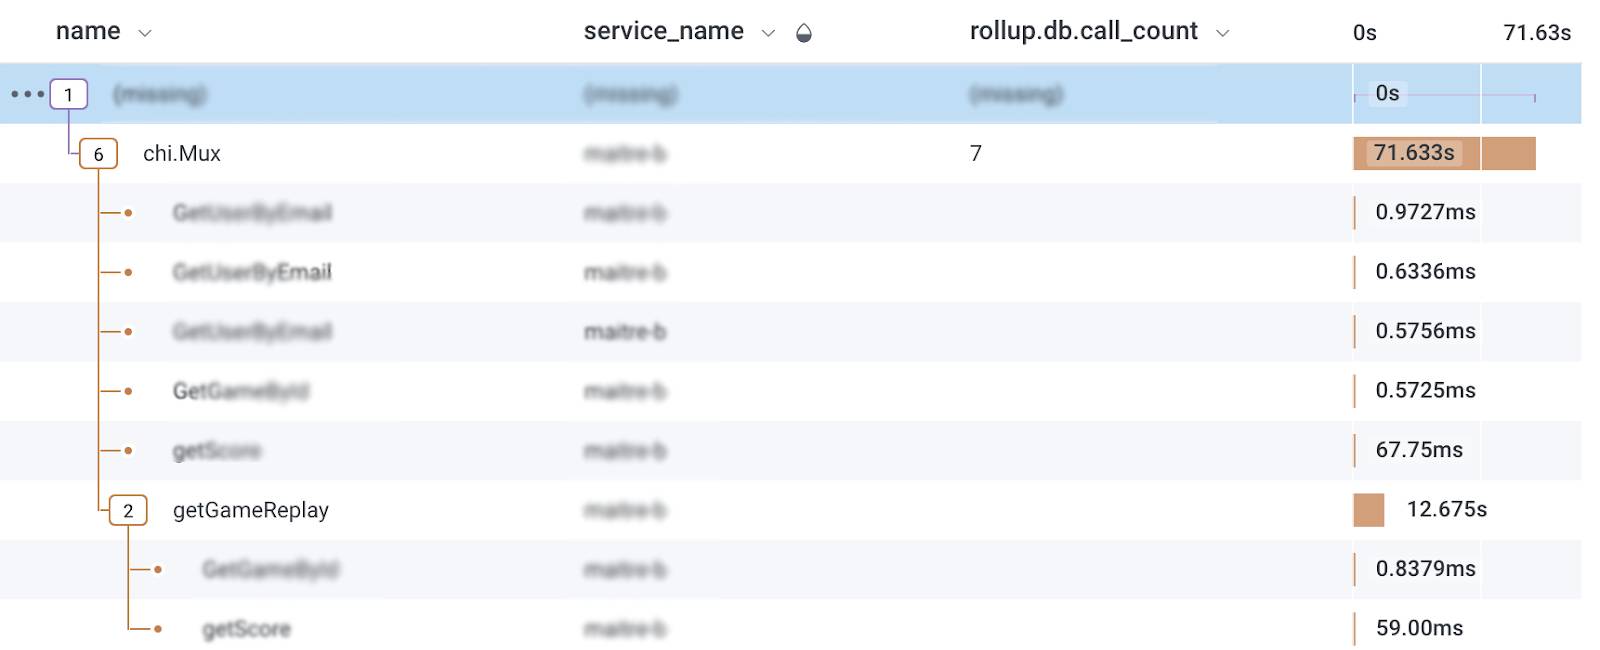
Although the tracing shows that something else is going on, 12s for a file download is way too long, so let’s fix this first. Here’s the code:
 func getGameReplay(ctx context.Context, h *Handler, gameID uint) ([]byte, error) {
	ctx, span := beeline.StartSpan(ctx, "getGameReplay")
	defer span.Send()

	game, err := h.gameService.GetGameById(ctx, gameID)  //Get the game to get the replay from
	if err != nil {
		return nil, err
	}

	key := game.GameFolder + "/" + game.ReplayUrl

	buff := &aws.WriteAtBuffer{}
	span.AddField("filename", key)
	downloader := s3manager.NewDownloaderWithClient(h.s3Client) //Download the replay
	numBytes, err := downloader.Download(buff,
		&s3.GetObjectInput{
			Bucket: &h.s3Bucket,
			Key:    &key,
		})

	span.AddField("filesize", numBytes)
	if err != nil || numBytes == 0 {
		return nil, err
	}

	return buff, nil
}
From our profiling, we could get that the origin of the buffer reallocation was coming from the WriteAtBuffer. Knowing that we have huge replays this year, there is a strong possibility that WriteAtBuffer was not optimized for these kind of size and lucky us, they have a method that allows us to provide a presized buffer !
So we’ll replace
buff := &aws.WriteAtBuffer{}
with
	buffer := make([]byte, 0, 1024*1024*55) // 55MiB
	buff := aws.NewWriteAtBuffer(buffer)
	buff.GrowthCoeff = 2
where we optimistically preallocate a 55MiB buffer to receive the replay and we should be good!
Of course it’s not that simple…
So we did pre-allocate an optimistically sized buffer, but the performance is still not up to our standard.
The change did help, as we can see in our tracing:
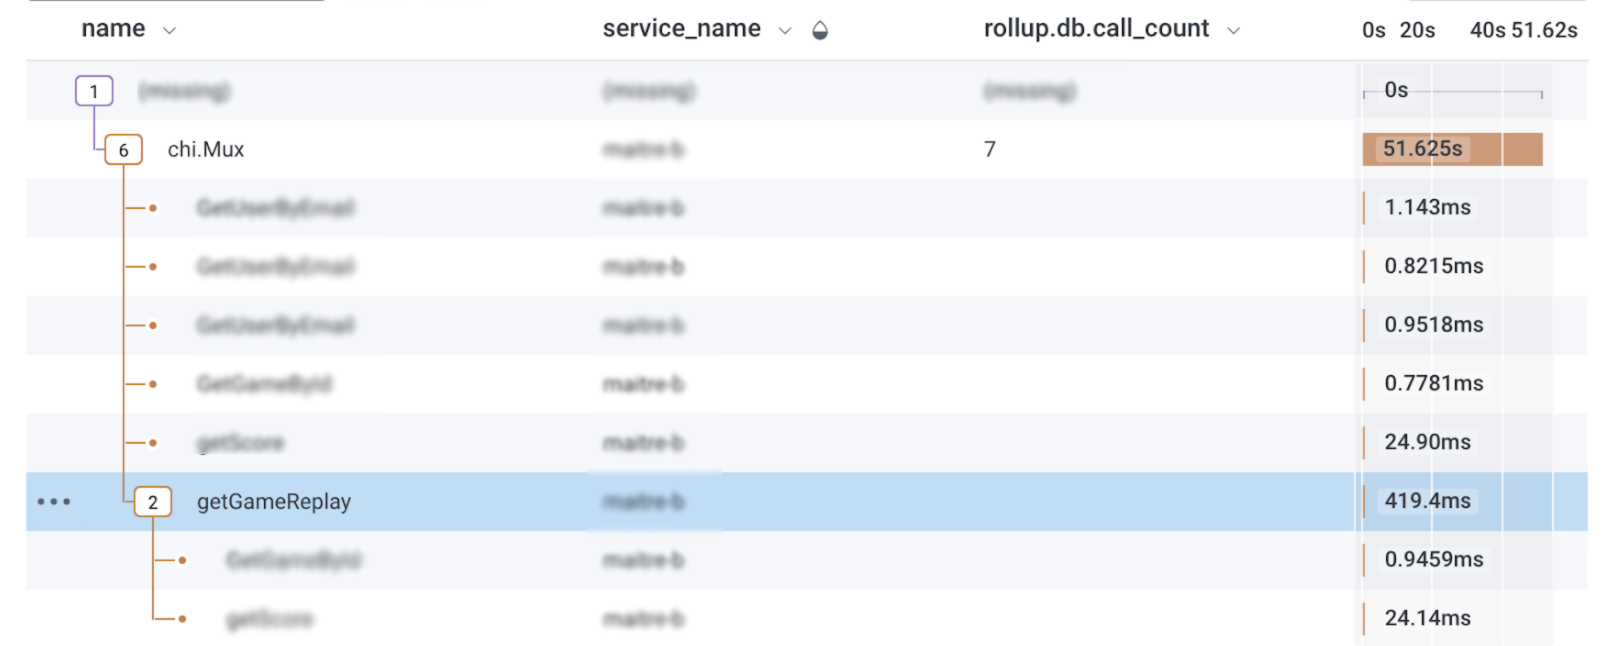 The video download is quite fast, but the overall method is still taking a lot of time 😱. What’s going on?! Let’s take a step back and look at the whole handler function.
func (h *Handler) gameReplayHandler(w http.ResponseWriter, r *http.Request, user *User) {
//bunch of validation

	buffer, err := getGameReplay(r.Context(), h, uint(gameID))
	if err == sql.ErrNoRows {
		WriteJSONErrorMessage(w, r, http.StatusNotFound, "Game not found")
		return
	} else if err != nil {
		WriteJSONInternalServerErrorAndLogError(w, r, err, &h.logger)
		return
	}

	w.Write(buffer.Bytes())
}
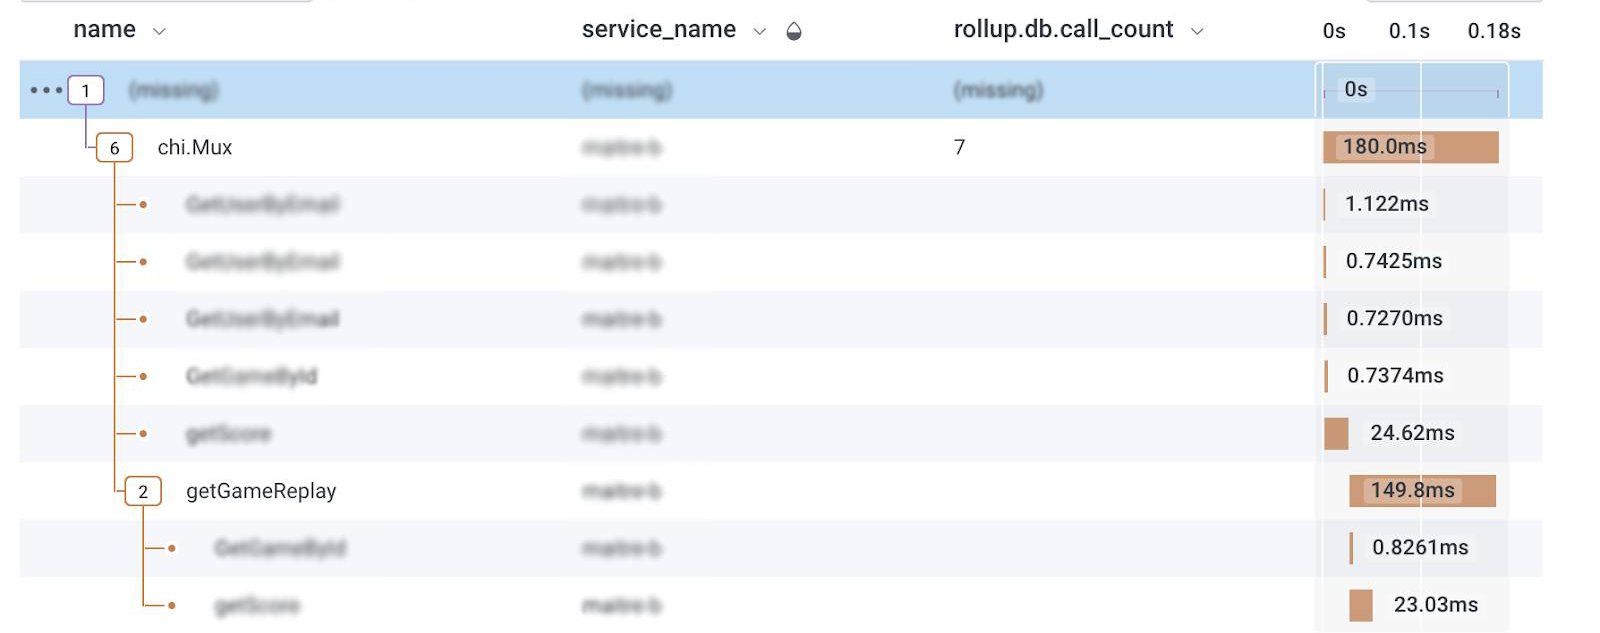
We can see from the tracing that the time is not spent in the getGameReplays and there is virtually nothing after it, aside from error handling and sending the bytes of the replay to the client.
A quick online search hinted that the problem could be with the http.ReponseWriter buffering the response and a call to Flush() could solve this problem, which … it did!
func (h *Handler) gameReplayHandler(w http.ResponseWriter, r *http.Request, user *User) {
	// Same as before
	w.Write(buffer.Bytes())

	//force flush - this is new
	if f, ok := w.(http.Flusher); ok { //Check if the ResponseWriter is a Flusher
		f.Flush()
	}
}
I wish I had a better story, where I launch another tool and I pinpoint exactly where the slowness is coming from, but I am lazy and a quick googling gave me enough confidence that calling Flush() could lead to some potential gain, which, lucky for me, it did.
What did we learn?
- In this specific case, preallocating the buffer is a great way to reduce useless, costly memory allocation and copy.
- Flushing the http.ResponseWriter saved the extra chunk of wasted time.
- Messing around with the code for hours will save you a solid minute of “reading the doc”.
- Profiling is key; understand where the bottleneck is before going around trying to fix stuff left and right.
- Observability is great in general. The tracing that comes with structured event logs is cherry on the top.
And for the curious, yes we did implement the pre-signed url solution. Spending time on a solution is not a good reason to preserve it in favor of a better solution ;).
I hope it helps if you’re starting with go and are looking forward to fixing performance issues. I’ll see you during Coveo Blitz :)
Thanks to Alexandre Moreau, Felix Pelletier, Kevin Larose, Jean-Francis Roy, Benjamin Audet, and Jacques-Etienne Beaudet for reviewing this text.
Come work with us, they don’t all hate CORS issues as much as I do :)