Coveo is rapidly growing, and moving fast; it can be a challenge to keep track of newcomers or to know what our colleagues are now working on.
To help us overcome this challenge, we created an internal People page using Coveo, where we showed recent contributions someone made alongside their profile, making it quite a useful tool for new employees to learn about their new co-workers.
To access someone’s page, we have a handy internal search page, which behaves like your typical people search page. But, when clicking on someone’s name, we access their profile.
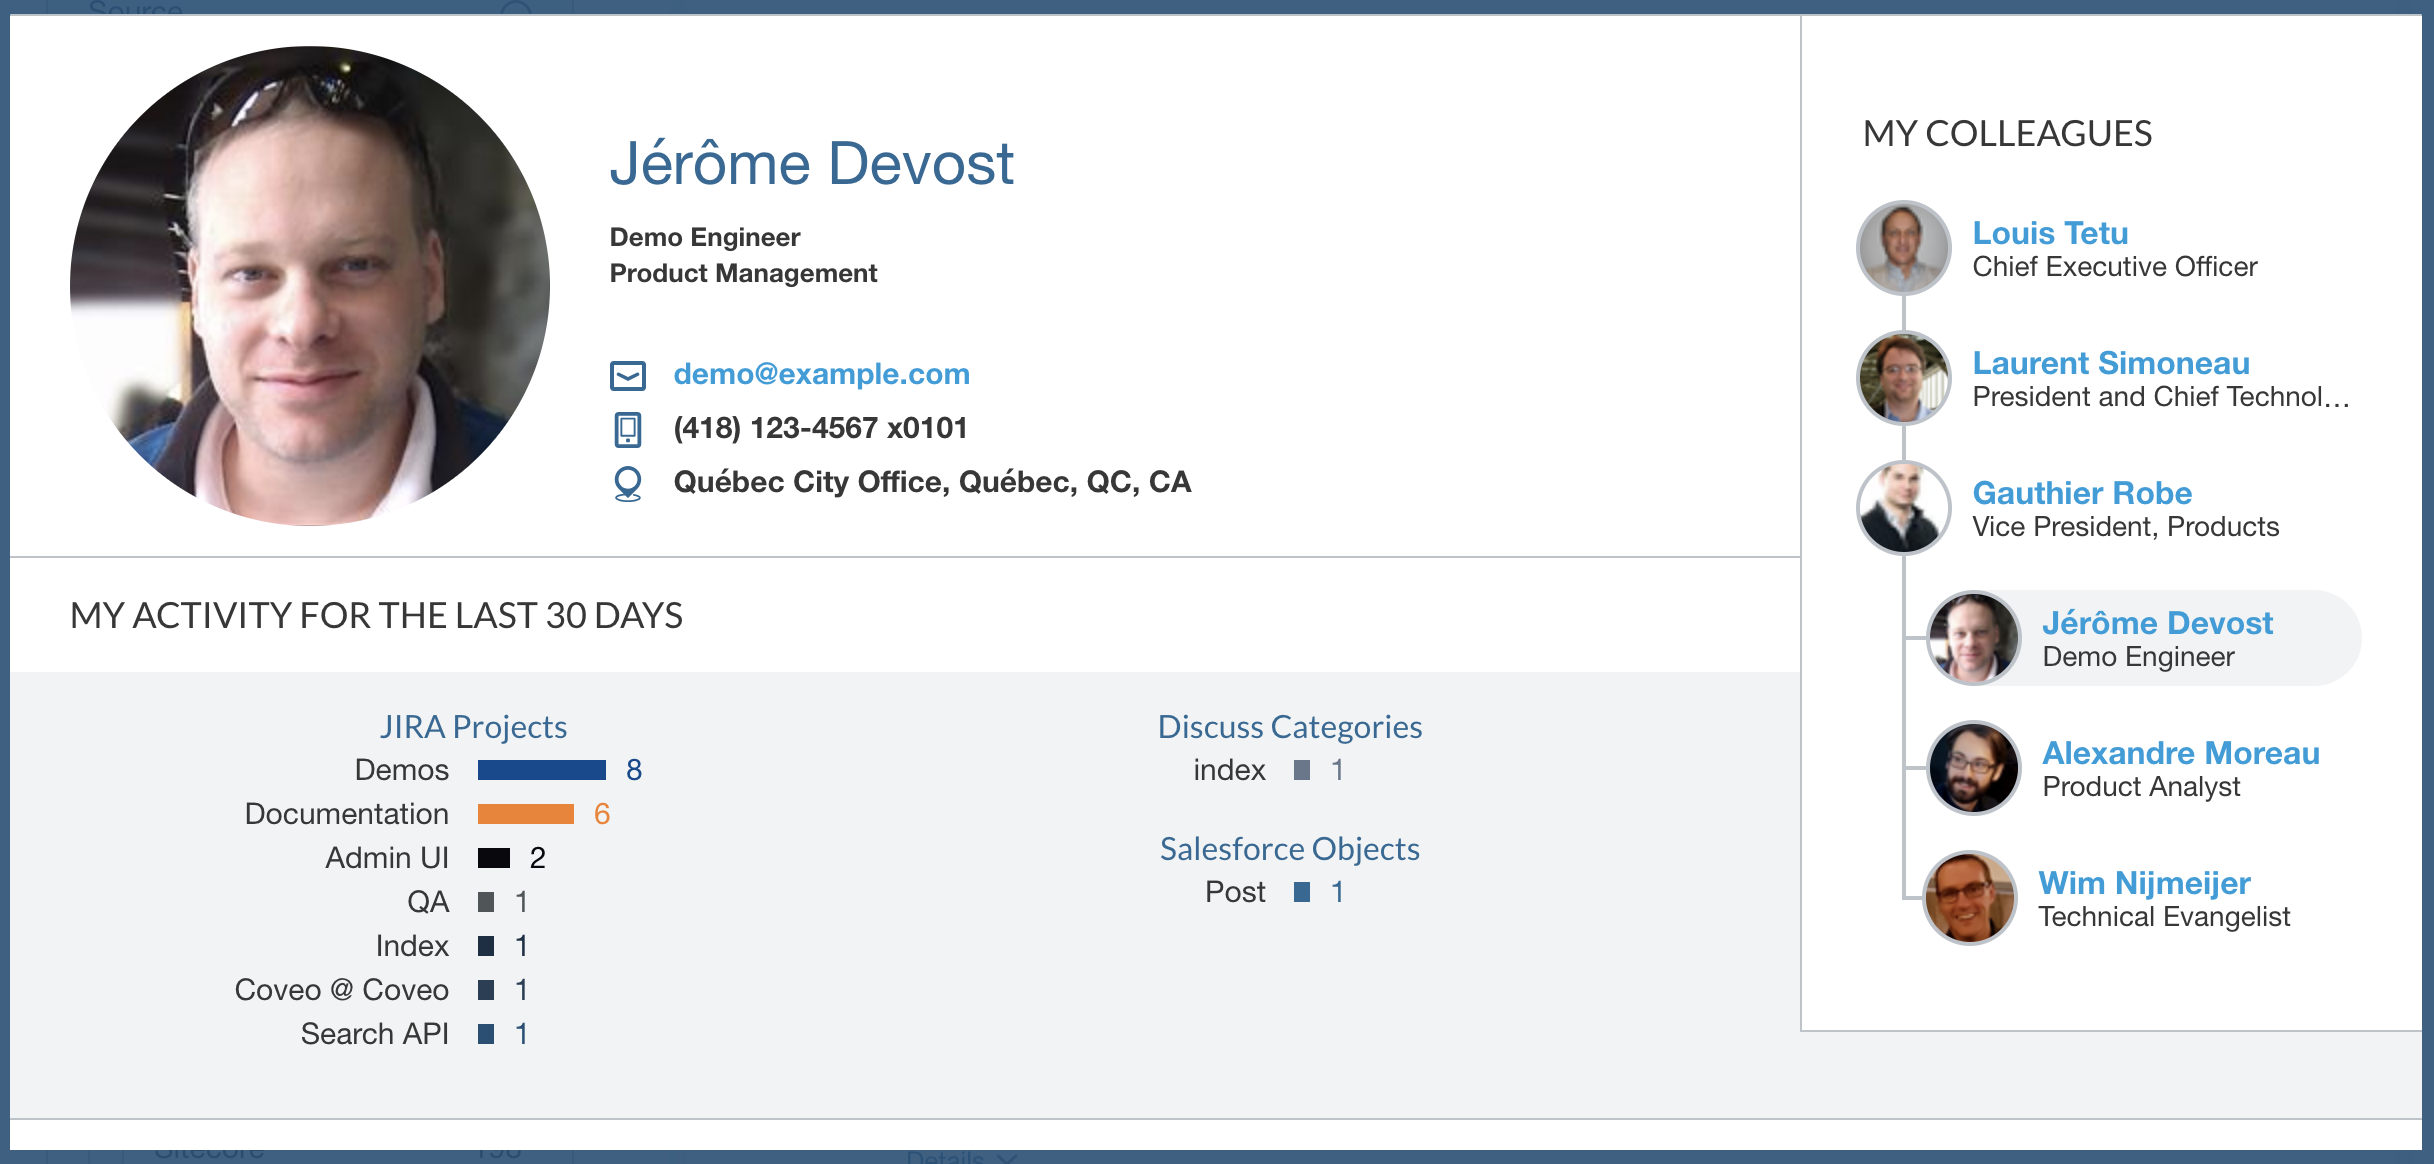
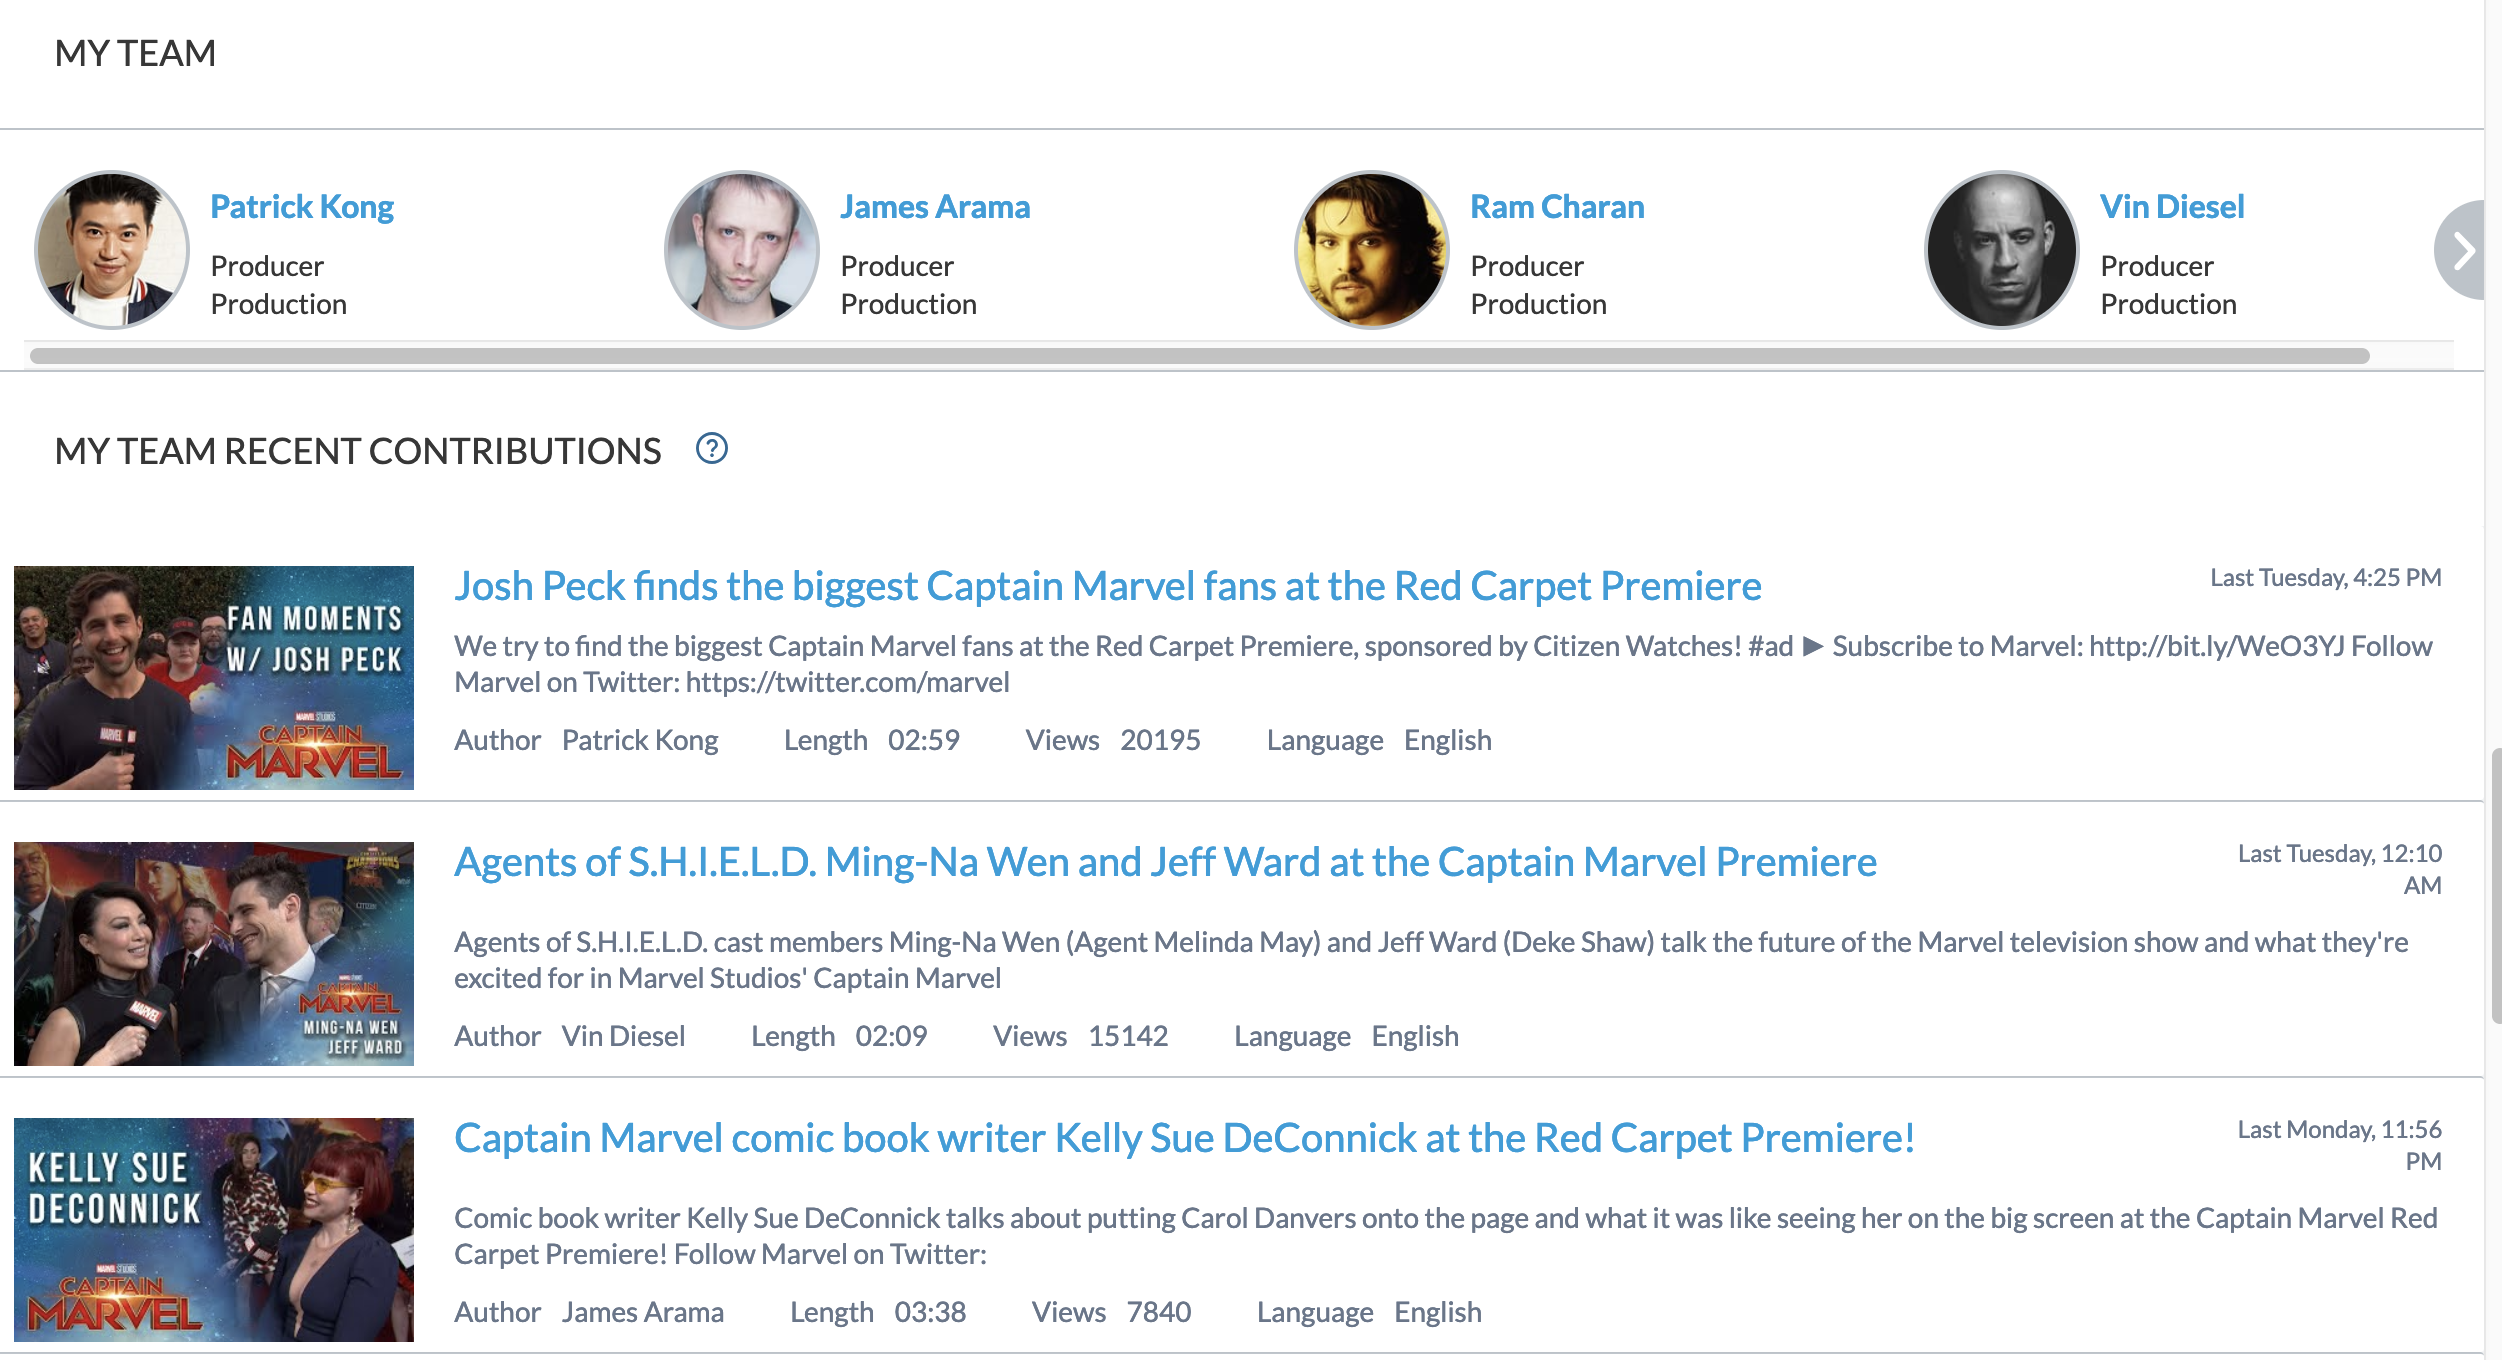
This profile shows a list of the employee’s recent contributions, team members, position in the organization chart, active projects, and the recent contributions from their team. The point of this page is to show their area of expertise within the company.
This profile - or People page - is still a Coveo Search page with the same great features like relevance or security. You won’t see secret projects from other members here if you don’t have access to these projects yourself.
The Data
Our People page is fed from our own index. Naturally, the first step is to get the data into our index.
To do so, we are crawling our Active Directory with our own crawler, before sending the data to a Push API source we called Employees.
For each person, we get their basic information (name, email, etc.) and their reporting structure (their manager and their direct reports).
We also have multiple other sources in our index: Salesforce, Jira, Discourse, Google Drive, Internal Documentation, Public Documentation, etc. Most sources have their own fields describing who created what and who modified it.
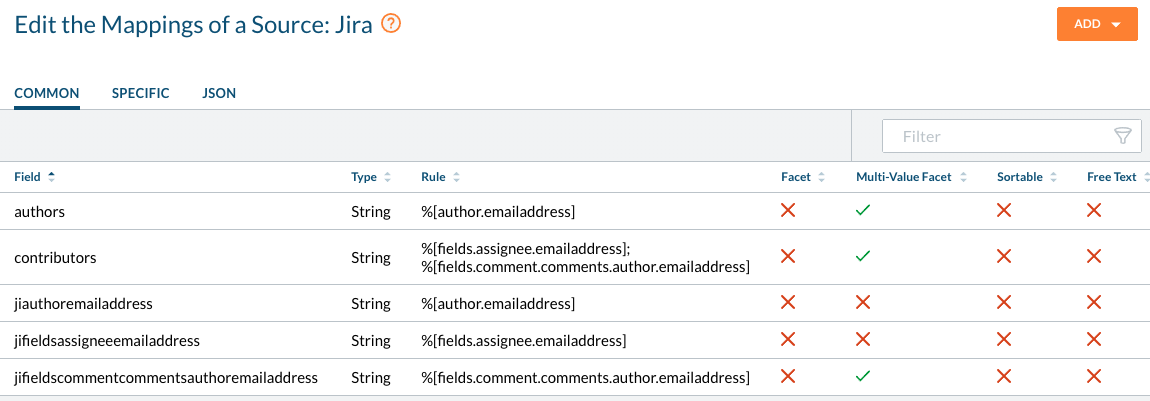
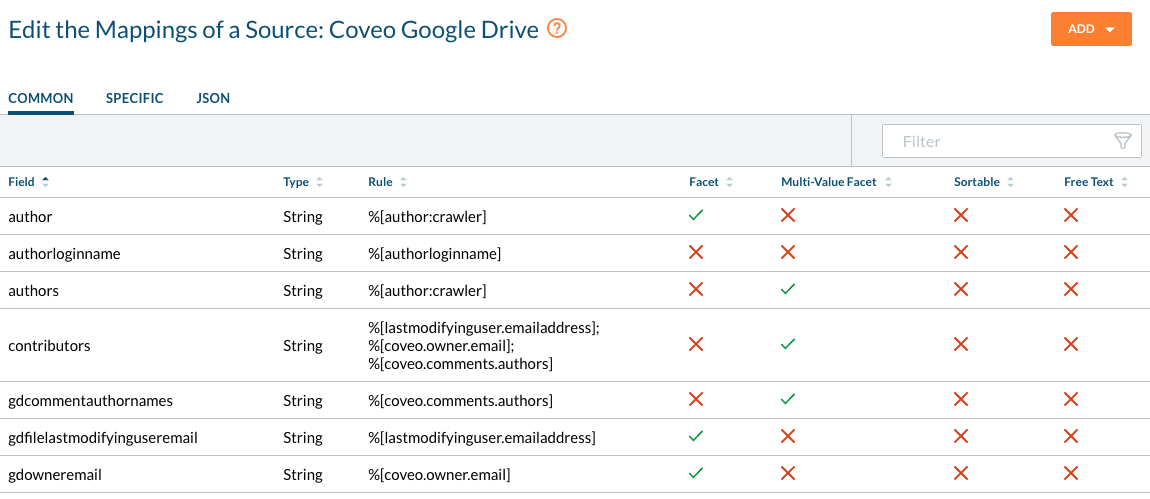
To reduce complexity at query time, we normalize the fields using common field names for all sources to identify who worked on a document. We called those fields @authors for document creators, and @contributors for people who modified the document; the fields are set as multi-value fields on the Coveo platform.
For example:
Our Jira source maps author.emailaddress to @authors, and fields.assignee.emailaddress and fields.comment.comments.author.emailaddress to @contributors.
Our Google Drive source maps author to @authors, and lastmodifyingyser.emailaddress, coveo.owner.email, and coveo.comments.authors to @contributors.
To create the Employee page below (taken from our intranet demo), we are using a few more tricks:
- GroupBy/Facets for the bar charts, with query events
- Browser cache for basic employee information
- Search interface and result templates
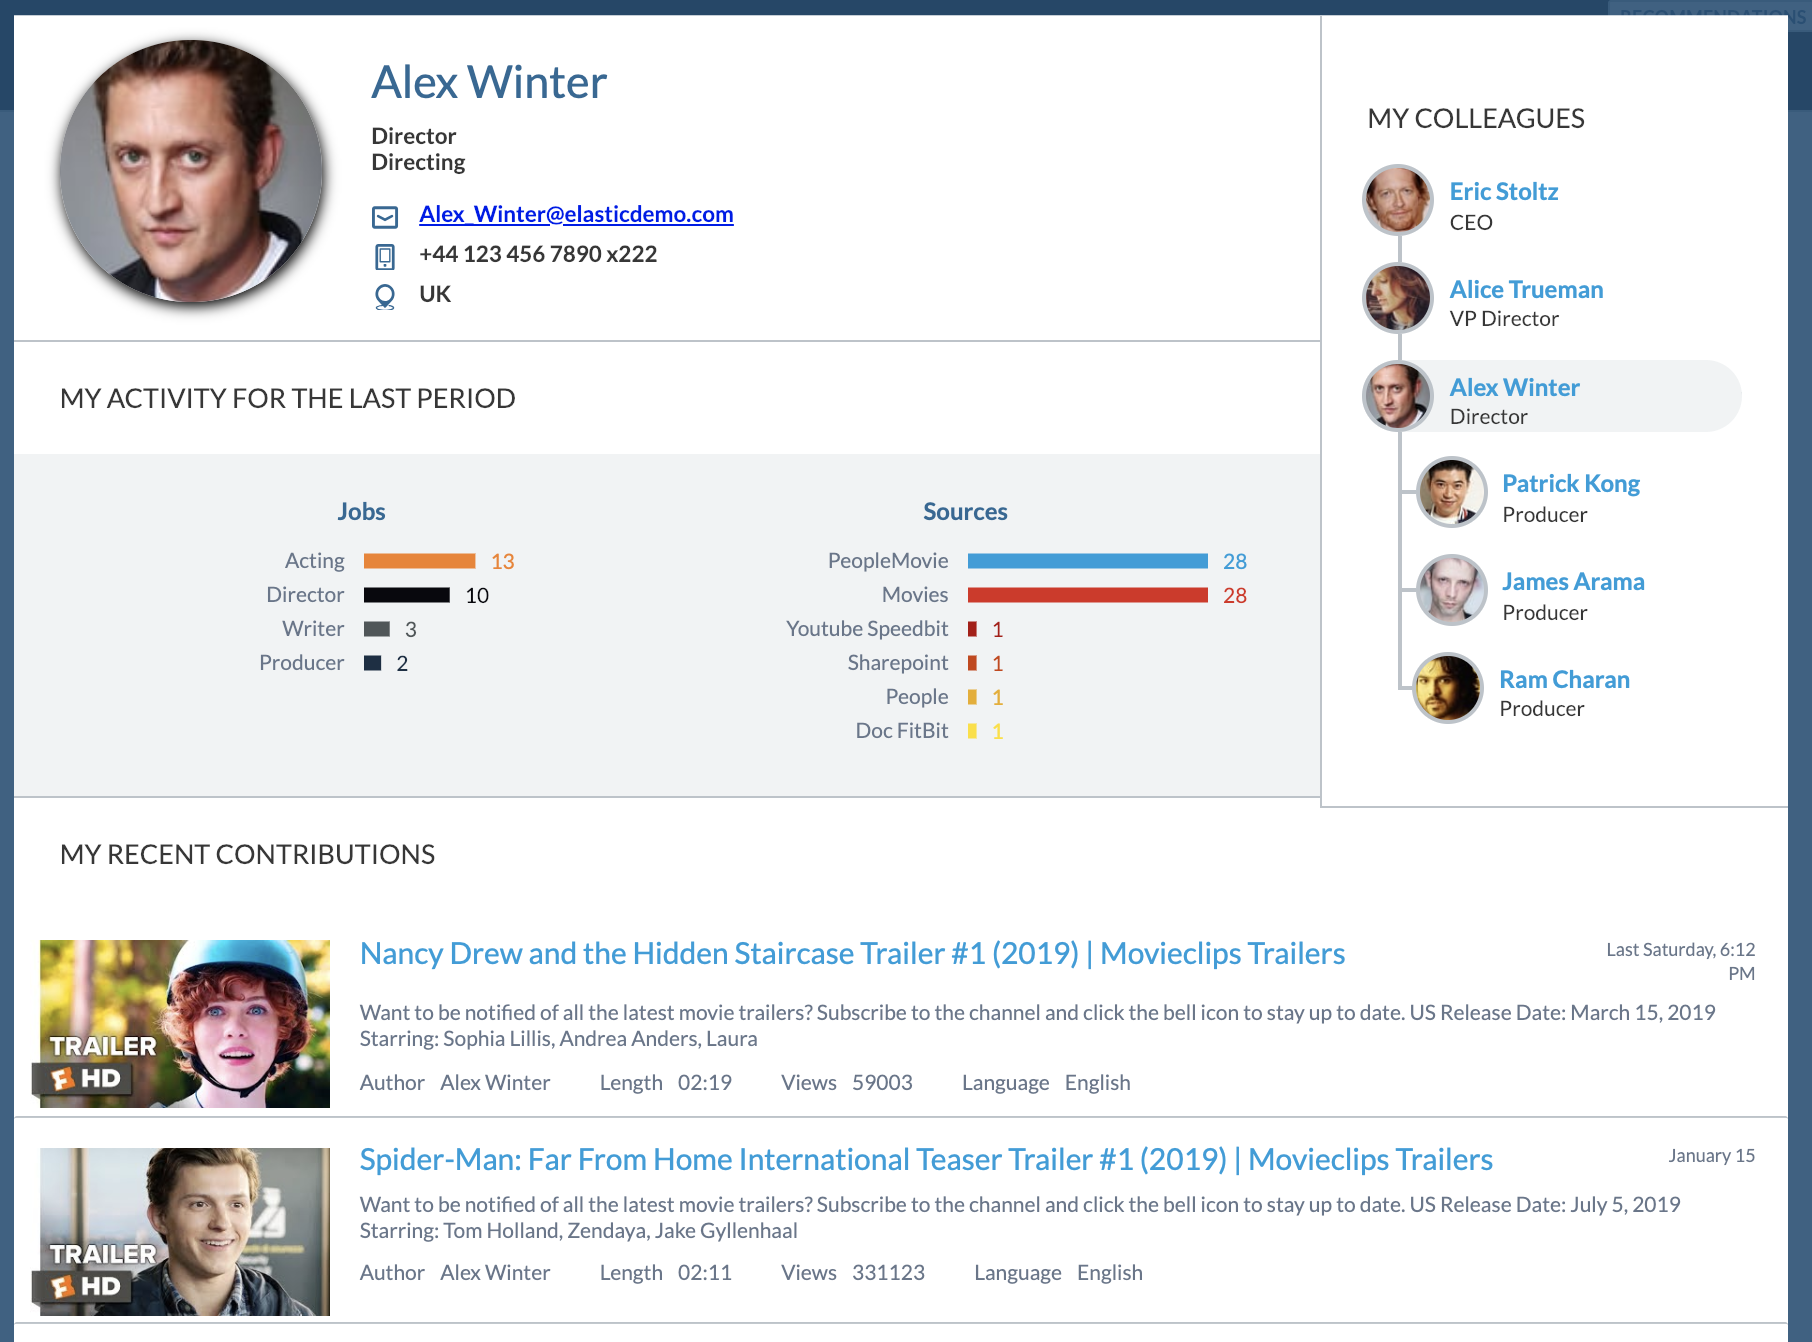
Getting People’s Contributions
Using the fields we mapped in the Indexing phase, we are getting the contributions of a person using the following query. Note that some systems only identify people using their full names and not their email address, so we need to expand them in the query.
q: @authors==("Alex_Winter@elasticdemo.com", "Alex Winter") OR @contributors==("Alex_Winter@elasticdemo.com", "Alex Winter")
aq: @date>="today-30d"
groupBy: [
  {"field":"@source","injectionDepth":1000},
  {"field":"@jiprojectname","injectionDepth":1000},
  {"field":"@discusscoveocategoryname","injectionDepth":1000},
  {"field":"@confspacename","injectionDepth":1000},
  {"field":"@objecttype","injectionDepth":1000}
]
We then do the same query for that person’s team, expanding all team members:
q: @authors==("Patrick_Kong@elasticdemo.com", "Patrick Kong", "James_Arama@coveo.com", "James Arama", "Walter_Sittler@coveo.com", "Walter Sittler") OR @contributors==("Patrick_Kong@elasticdemo.com", "Patrick Kong", "James_Arama@coveo.com", "James Arama", "Walter_Sittler@coveo.com", "Walter Sittler")
We show how we get the team members below, when we build the Org chart.
Facets as bar charts
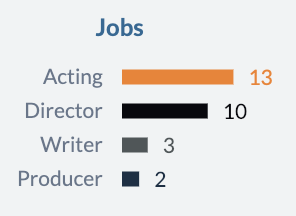
In search responses, the facets information is stored in the JSON as a groupBy. It’s an array of field and their associated values to show in the facets, along with the count for each value as numberOfResults. It looks something like this:
[{
  "field": "@source",
  "values": [
    { "value": "PeopleMovie", "numberOfResults": 28 },
    { "value": "Movies", "numberOfResults": 28 },
    { "value": "Youtube Speedbit", "numberOfResults": 1 },
    { "value": "Sharepoint", "numberOfResults": 1 },
    { "value": "People", "numberOfResults": 1 },
    { "value": "Doc FitBit", "numberOfResults": 1 }
  ]
}, {
  "field": "@myjob",
  "values": [
    { "value": "Acting", "numberOfResults": 13 },
    { "value": "Director", "numberOfResults": 10 },
    { "value": "Writer", "numberOfResults": 3 },
    { "value": "Producer", "numberOfResults": 2 }
  ]
}, {
  "field": "@myrole",
  "values": [
    { "value": "Director", "numberOfResults": 11 },
    { "value": "Writer", "numberOfResults": 3 },
    { "value": "Himself", "numberOfResults": 3 },
    { "value": "Producer", "numberOfResults": 2 },
    { "value": "Bill S. Preston", "numberOfResults": 2 },
    { "value": "Schatzi Greenspace", "numberOfResults": 1 },
    { "value": "Marko", "numberOfResults": 1 }
  ]
}]
Each value becomes one bar in the chart, and is represented using this HTML code:
<div class="userpage-stats-item">
  <div class="userpage-stats-label" title="Acting">Acting</div>
  <svg width="200" height="20" viewBox="0 0 200 20" xmlns="http://www.w3.org/2000/svg">
    <line x1="0" y1="10" x2="160" data-value="13" data-max="13" y2="10" stroke-width="10" stroke="#F58020"></line>
    <text x="170" y="15" fill="#F58020">13</text>
  </svg>
</div>
We use a Query Event (querySuccess) to process the results into the bar charts:
// Handler for the search response
// The generated HTML will update a DOM node (id="userpage-stats") already present on the page
let onSuccess = function(e, args) {
  let groupByResults = args.results.groupByResults;
  if (groupByResults.length) {
    let barChartsHtml = [
      generateStatsForSection('Sources', groupByResults[0].values),
      generateStatsForSection('Jobs', groupByResults[1].values),
      generateStatsForSection('Characters', groupByResults[2].values)
    ];

    $('#userpage-stats')
      .empty()
      .html( barChartsHtml.join('') );
  }
};

// Generate the HTML and SVG code (bar chard) for a category.
let generateStatsForSection = function(name, results) {
  // Calculate the maximum value for this section, to get relative sizes for the bars
  const max = Math.max(...(results.map(result => result.numberOfResults)));

  // Creates an array of bars (in HTML code)
  let aHtml = results.map( (result, idx) => {
      const color = COLORS[idx % COLORS.length]; // We use a prefined array of colors, and we cycle through them
      const xPos = Math.min(160, (160 * result.numberOfResults) / max); // Maximum value will be set at 160px

      // HTML + SVG code for a bar, using JavaScript's template literals
      return `<div class="userpage-stats-item">
          <div class="userpage-stats-label" title="${e(result.value)}">${e(result.value)}</div>
          <svg width="200" height="20" viewBox="0 0 200 20" xmlns="http://www.w3.org/2000/svg">
            <line x1="0" y1="10" x2="${xPos}" data-value="${result.numberOfResults}" data-max="${max}" y2="10" stroke-width="10" stroke="${color}"></line>
            <text x="${xPos + 10}" y="15" fill="${color}">${result.numberOfResults}</text>
          </svg>
        </div>`;
    });

  // Return the generated HTML for all bars in this section
  return aHtml.join('\n');
};

Coveo.$$(root).on('querySuccess', onSuccess);
Tip: you can use inline SVG to generate other types of visualizations, or third party libraries like D3 with the result numbers from groupBy.
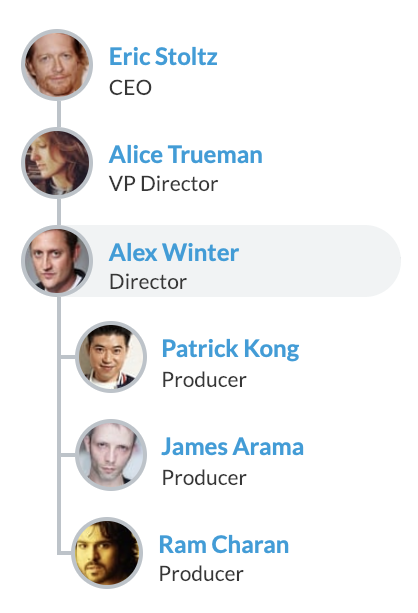
Optimizations using the browser cache
The Team section and the organization chart are built dynamically client side, in the browser. To keep it simple, we are fetching one user at a time, then their manager if they have one, then the manager’s manager, and so on.
While being quite simple to use, it would be inefficient to redo the same queries for the same members when browsing the org chart. We use the browser’s session storage to make it more efficient. We will fetch one member information only once per web session, which is perfect for this case. This way we get the efficiency of doing only one request per member, and we don’t have to manage the cache ourselves; the browsers do it and the cache for the members stays fresh.
We use a JavaScript promise to get the User (member) info. We first check if the member is in the cache. If not, we query it, store it, and then resolve the promise.
Here’s the code to get the user info:
/**
 * This function checks the browser's (session) storage for the user info, using their email as the key.
 * If necessary, the function will query Coveo for the info and cache it before returning.
 * @param userEmail {string} email of the user to get
 * @returns {Promise}
 */
async getUserInfo(userEmail) {
  const key = `@email=="${userEmail}"`;

  // Check storage using email query as key
  let user = sessionStorage.getItem(key);
  if (user) {
    // Find the user info in storage, parse it, and return it
    return Promise.resolve(JSON.parse(user));
  }

  const myQueryBuilder = new Coveo.QueryBuilder();
  myQueryBuilder.expression.add(key); // Query using the user email
  myQueryBuilder.expression.addFieldExpression('@filetype', '==', ['activedirperson']); // Limit results to Active Directory

  const coveoSearchEnpoint = Coveo.SearchEndpoint.endpoints['default'];
  const searchPromise = coveoSearchEnpoint.search(myQueryBuilder.build());
  searchPromise.then(queryResults => {
    // Validate result before saving it in the browser's session storage
    let results = queryResults.results;
    let user = null;
    if (results && results.length) {
      user = results[0].raw;
      if (userEmail === user.email) {
        sessionStorage.setItem(key, JSON.stringify(user)); // User is valid. Save it in session storage
      } else {
        console.error(`WRONG user; userEmail "${userEmail}" (used as key) doesn't match the returned user.email "${user.email}". `);
      }
    }
    return user;
  });

  return searchPromise;
}
Now, we put it all together in a Class to create an organization chart:
class OrgChart {

  async getUserInfo(user) {
    // See the code above
  }

  async getUsersInfo(users) {
    if (users) {
      return Promise.all(
        users.map(email => {
          return this.getUserInfo(email);
        })
      );
    }
    return Promise.resolve([]);
  }

  async showOrg(userEmail) {
    const userJson = await this.getUserInfo(userEmail);
    const managersJson = await this.getUsersInfo(userJson.managers);
    const directReportsJson = await this.getUsersInfo(userJson.directreports);

    this.renderOrg(userJson, managersJson, directReportsJson);
  }

  renderOrg(user, managers, directReports) {
    // Create your own layout for your Company
  }

}
Conclusion
Coveo search interfaces don’t always need to have your typical search page experience; they can be used as an aggregator of relevant content for one topic - in this case, an employee.
We used a few tricks from the Coveo platform like query events and facets to create different visualizations. We also have the peace of mind from Coveo’s support of secured content that sensitive information won’t be surfaced to the wrong users.
Using the same approach, many applications such as a landing/welcome page for an Intranet or Products pages can be created using the Coveo platform, or the No Results or 404 - Not Found pages.