For almost a year, Coveo has been offering Lightning components in Salesforce as part of its search offering. Over time, we had to develop new ways to debug these components both inside and outside of a developer environment. Here are some of the tips and tricks that we discovered along the way.
Enable the Debug Mode
First and foremost, to make things easier to develop, enable the Debug Mode for Lightning Components (found under Setup > Lightning components > Enable lightning debug mode). This helps you understand what is happening, and allows Chrome to load the debugger when needed; minified code can be difficult to load and can make Chrome lag.

Install the Salesforce Lightning Inspector
Second, install the Salesforce Lightning Inspector and the Salesforce Developer Tool Suite. The Salesforce Lightning Inspector adds a tab in your Chrome developer tools. Simply browse to a Lightning page, and you will see the Lightning tab appear.

The Lightning inspector gives you information about the state of a page or component with the current attribute’s values, information about the performance, a transactions log, an event log, and the current storage.
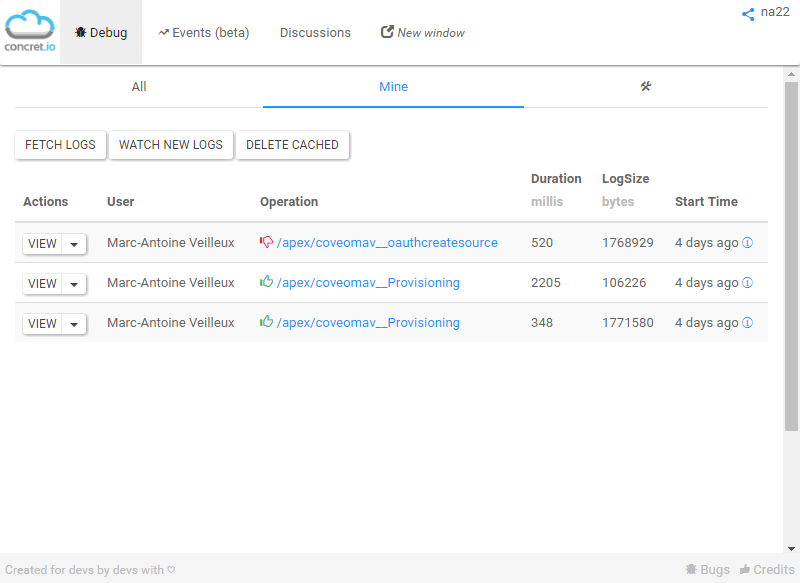
If you have the @AuraEnabled apex method, you will need to check the logs. This is where another extension, the Salesforce Developer Tool suite, comes in handy. The trick is to open the extension while in the Salesforce Administration tool and click New Window in the extension. Set up your user like you normally would with regular Salesforce logs; you can now start having some fun with your community.

From there, you’ll be able to see the logs for the Aura Enabled method in real time. Add System.debug('foobar') in your Apex method to get the information you need.
Debugging JavaScript Errors
In your JavaScript code (Renderer, Controller, or Helper), you can start a debugging session using the JavaScript debugger keyword. Simply add it to your code at the place you want to debug; Chrome will stop running the code when hitting the keyword.
While this always works, it can be slightly cumbersome, for example when you can’t change the code, as in a managed package with Lightning components. To debug these, you must use the source tab in your Chrome Developer Tools.
For instance, let’s say that you are trying to debug your Lightning component, and get a big red popup message with a poorly written error message.
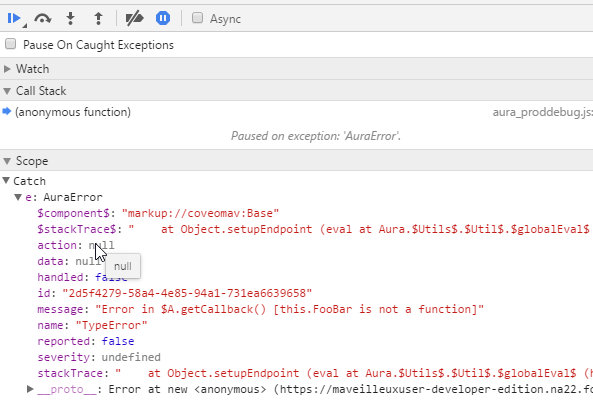
First, in the Chrome Developer Tools, under the Sources tab, enable the Pause on exceptions button. This pauses the code on the Aura exception thrown when there are exceptions in your components.

You can then try to reproduce the issue while the developer tools are open. With the current scope, you’ll get an AuraError with a lot more information about the issue.

Most of the time, the stack trace can help you figure out which part of your application is problematic. Using the Go to line shortcut (CTRL+G), you can navigate to the faulty code. If the code isn’t evaluated on runtime, you can also add a breakpoint in the source code.
Using Debug Logs
When all else fails, you can use the old debug logs. In your code, simply enter console.log('foobar') to enter text in the Chrome console when the code is run.
I recommend having a debug attribute on the Lightning component that activates error logging. Because Lightning isn’t easy to debug, you should really consider having tracing logs in as many places as possible in your JavaScript methods.
This is what I got! If I find any other or better ways, I’ll update this post.
Happy debugging!
